Figure 7. Retinal wholemount of total and activated microglia in RA and OIR mice. A: Iba1 staining in the retinas of RA mice and OIR mice. The white arrow denotes activated microglia. B: Quantification of total microglial density and percent active microglial. RA = room air; OIR = oxygen-induced ischemic retinopathy;
P = postnatal day. Four RA mice and four OIR mice were examined for each developmental age studied. Stars denote level of
significance: *p< 0.05, **p< 0.01, ***p< 0.001, and ****p< 0.0001. Sampling size: n=4 for each group. Error bars represent
SEM.
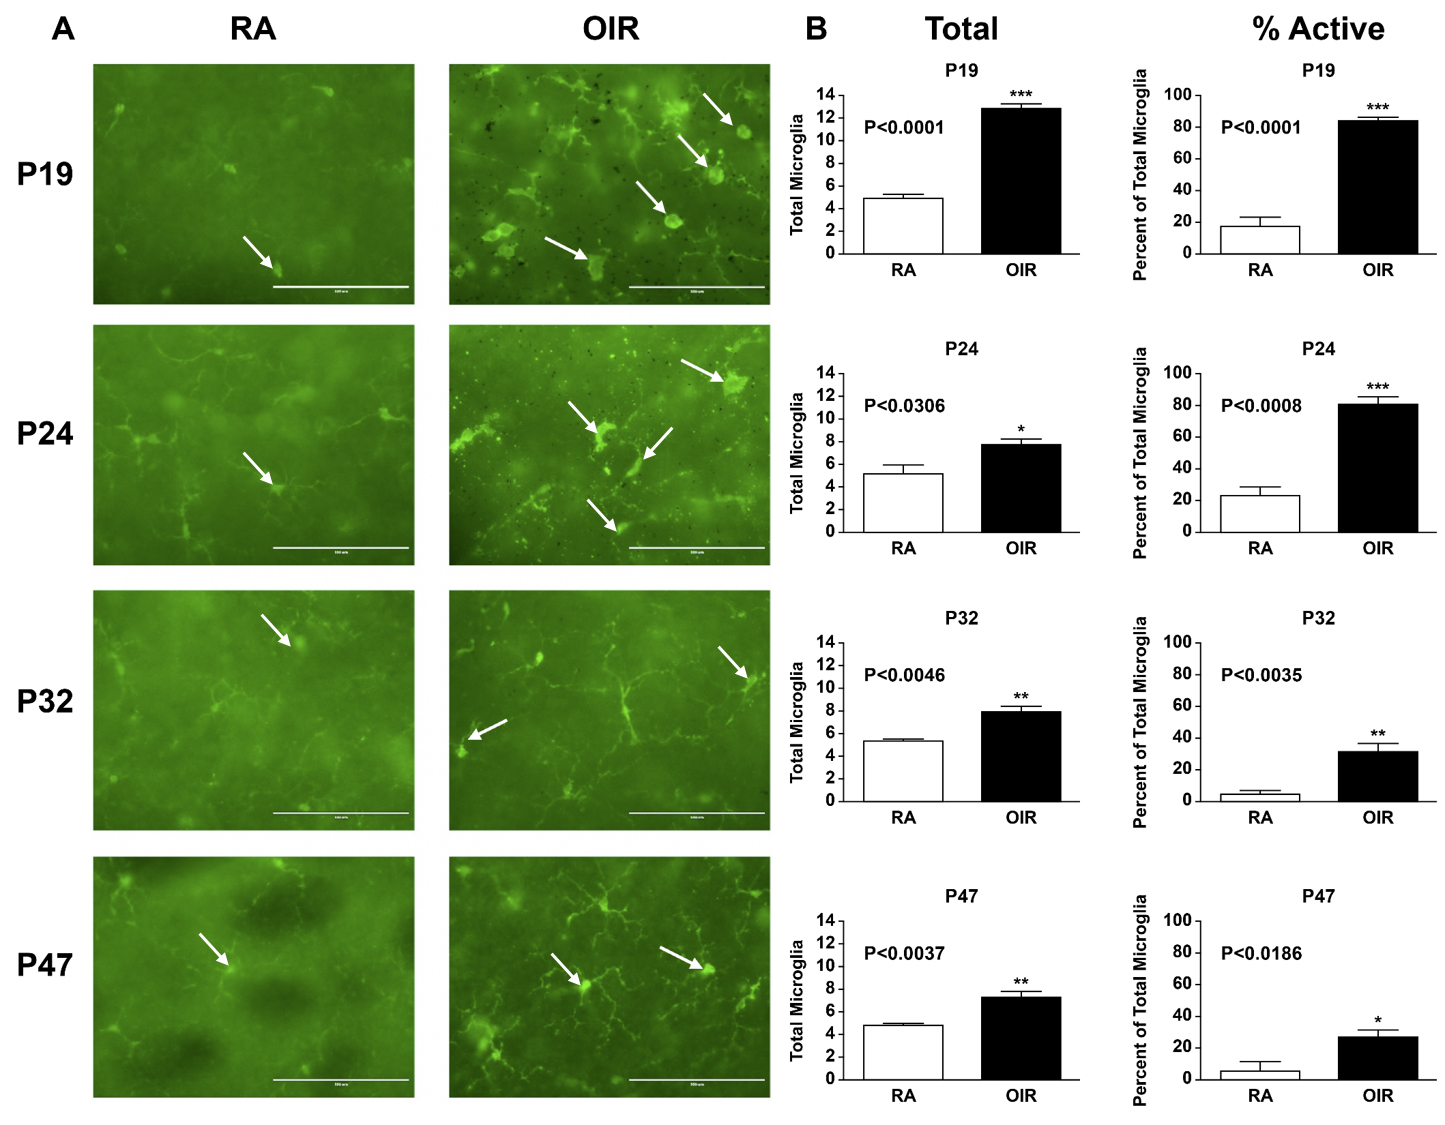
 Figure 7 of
Mezu-Ndubuisi, Mol Vis 2020; 26:257-276.
Figure 7 of
Mezu-Ndubuisi, Mol Vis 2020; 26:257-276.