Figure 5. GFAP staining at P19, P24, P32, and P47 in RA and OIR mice. A: GFAP staining in RA mice. B: GFAP staining in OIR mice. White double arrow shows astrocyte location in the nerve fiber layer. Yellow double arrow head
shows Müller cell location spanning the entire retinal cross section. C: Quantification of GFAP expression in RA and OIR mice with increasing developmental age. RA = room air; OIR = oxygen-induced
ischemic retinopathy; P = postnatal day; GFAP = glial fibrillary acidic protein. Three RA mice and three OIR mice were examined
for each developmental age studied. Stars denote level of significance: *p< 0.05, **p< 0.01, ***p< 0.001, and ****p< 0.0001.
Sampling size: n=3 for each group. Error bars represent SEM.
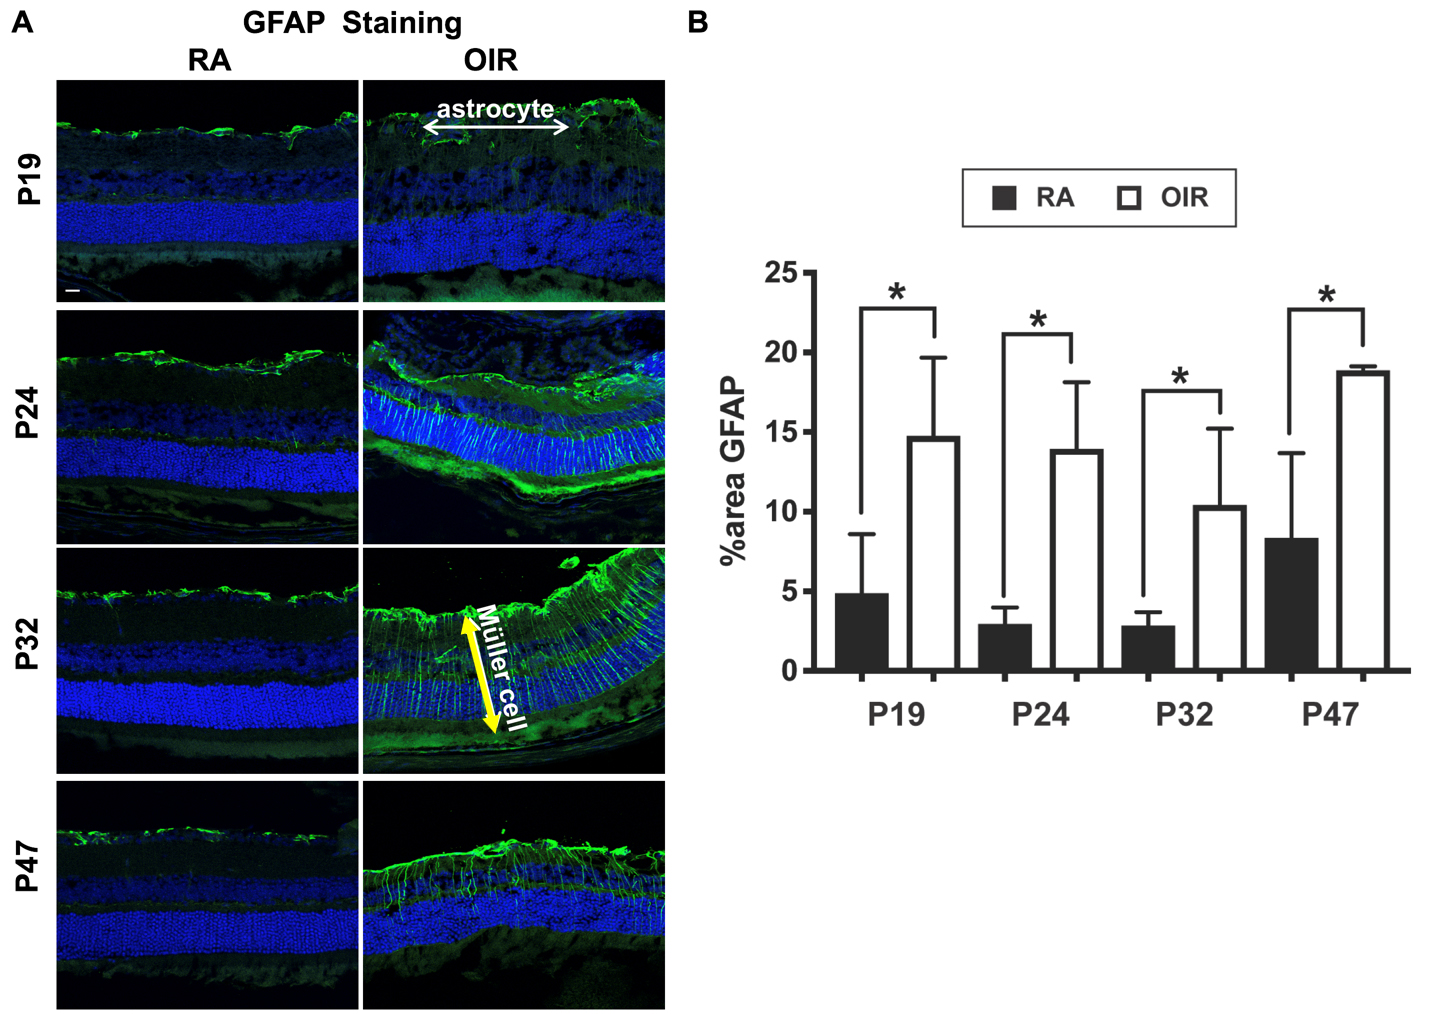
 Figure 5 of
Mezu-Ndubuisi, Mol Vis 2020; 26:257-276.
Figure 5 of
Mezu-Ndubuisi, Mol Vis 2020; 26:257-276.