Figure 2. Retinal thickness analysis at P19, P24, P32, and P47 in RA and OIR mice. A: H&E cross sections of retinas of the RA mice. Histology shows normal architecture at P19 and P47. B: Retinal cross section of the OIR mice. Histology shows neovascularization (red arrow) at P1, inner retinal thinning, and
disorganized retina architecture, particularly the outer retina. Neovascularization above the inner limiting membrane is shown
with a red double arrow. C: OIR mice showing dilated blood vessels (red arrow) in the GCL. H&E shows an increase in the blood vessel number and dilation
in the OIR mice and the disorganized OPL. H&E = hematoxylin & eosin; RA = room air; OIR = oxygen-induced ischemic retinopathy;
P = postnatal day; GCL = ganglion cell layer, INL = inner nuclear layer; IPL = inner plexiform layer; OPL = outer plexiform
layer; ONL = outer nuclear layer. Three RA mice and three OIR mice were examined for each developmental age studied.
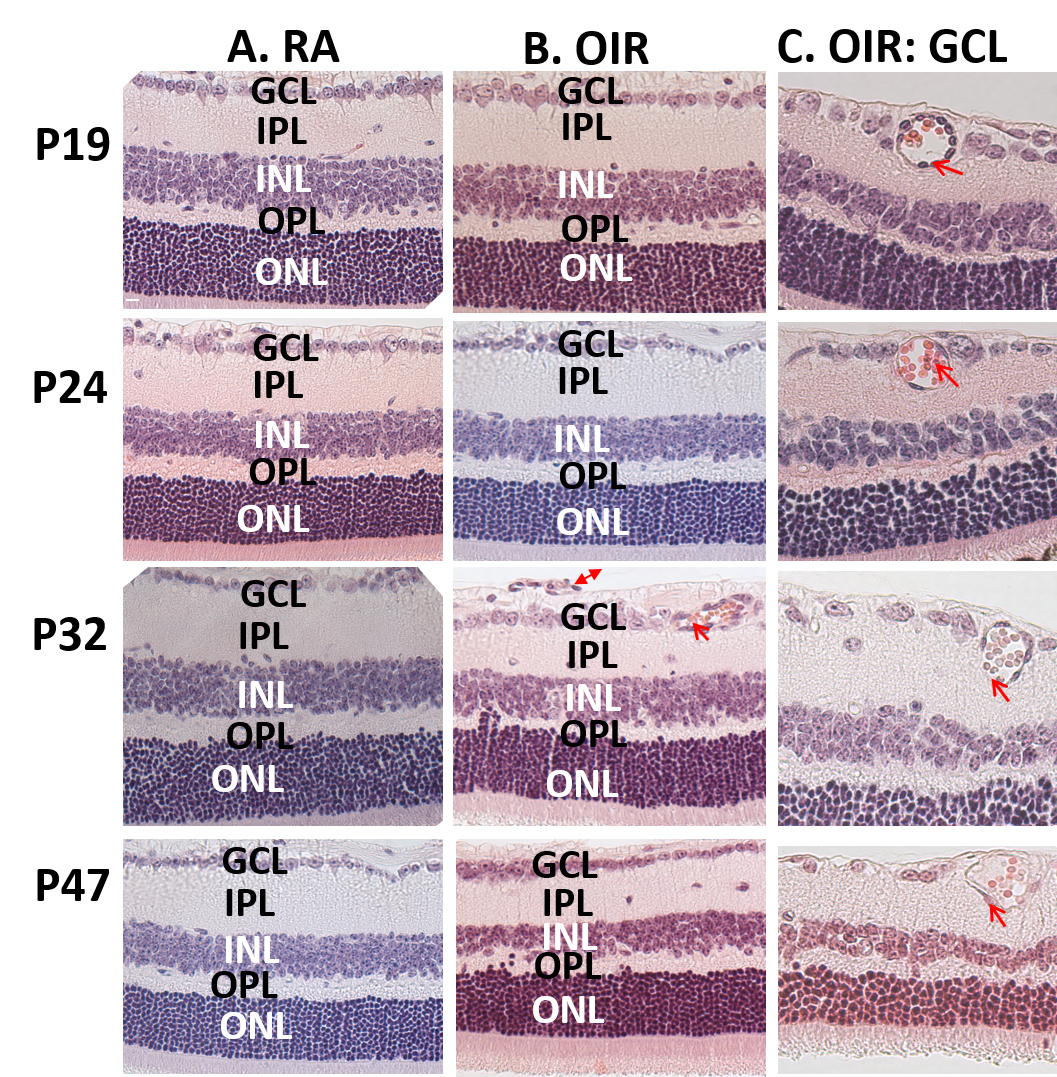
 Figure 2 of
Mezu-Ndubuisi, Mol Vis 2020; 26:257-276.
Figure 2 of
Mezu-Ndubuisi, Mol Vis 2020; 26:257-276.