Figure 7. Levels of ubiquilins are altered in lenses of homozygous Cx50D47A mice with or without the deletion of p62. A–C: Immunoblots show levels of UBQLN1 (A), UBQLN2 (B), and UBQLN4 (C) in lens homogenates prepared from 1-month-old wild-type (p62+/+-Cx50+/+), or heterozygous (p62+/+-Cx50+/D47A) or homozygous (p62+/+-Cx50D47A/D47A) Cx50D47A mice. The migration positions of the molecular mass markers are indicated on the left. The graphs show the densitometric
values of the immunoreactive ubiquilin bands. Data are presented as the mean (bar) + standard error of the mean (SEM; n =
3 sets) in arbitrary units (a.u.). D–F: Immunoblots show levels of UBQLN1 (D), UBQLN2 (E), and UBQLN4 (F) in lens homogenates prepared from 1-month-old homozygous Cx50D47A mice that were wild-type (p62+/+-Cx50D47A/D47A) or heterozygous (p62+/−-Cx50D47A/D47A) or homozygous (p62−/−-Cx50D47A/D47A) p62 null. The migration positions of the molecular mass markers are indicated on the left. The graphs show the densitometric
values of the immunoreactive ubiquilin bands. Data are presented as the mean (bar) + SEM (n = 3 sets) in arbitrary units (a.u.).
Asterisks denote statistically significant differences from wild-type lenses (p<0.05).
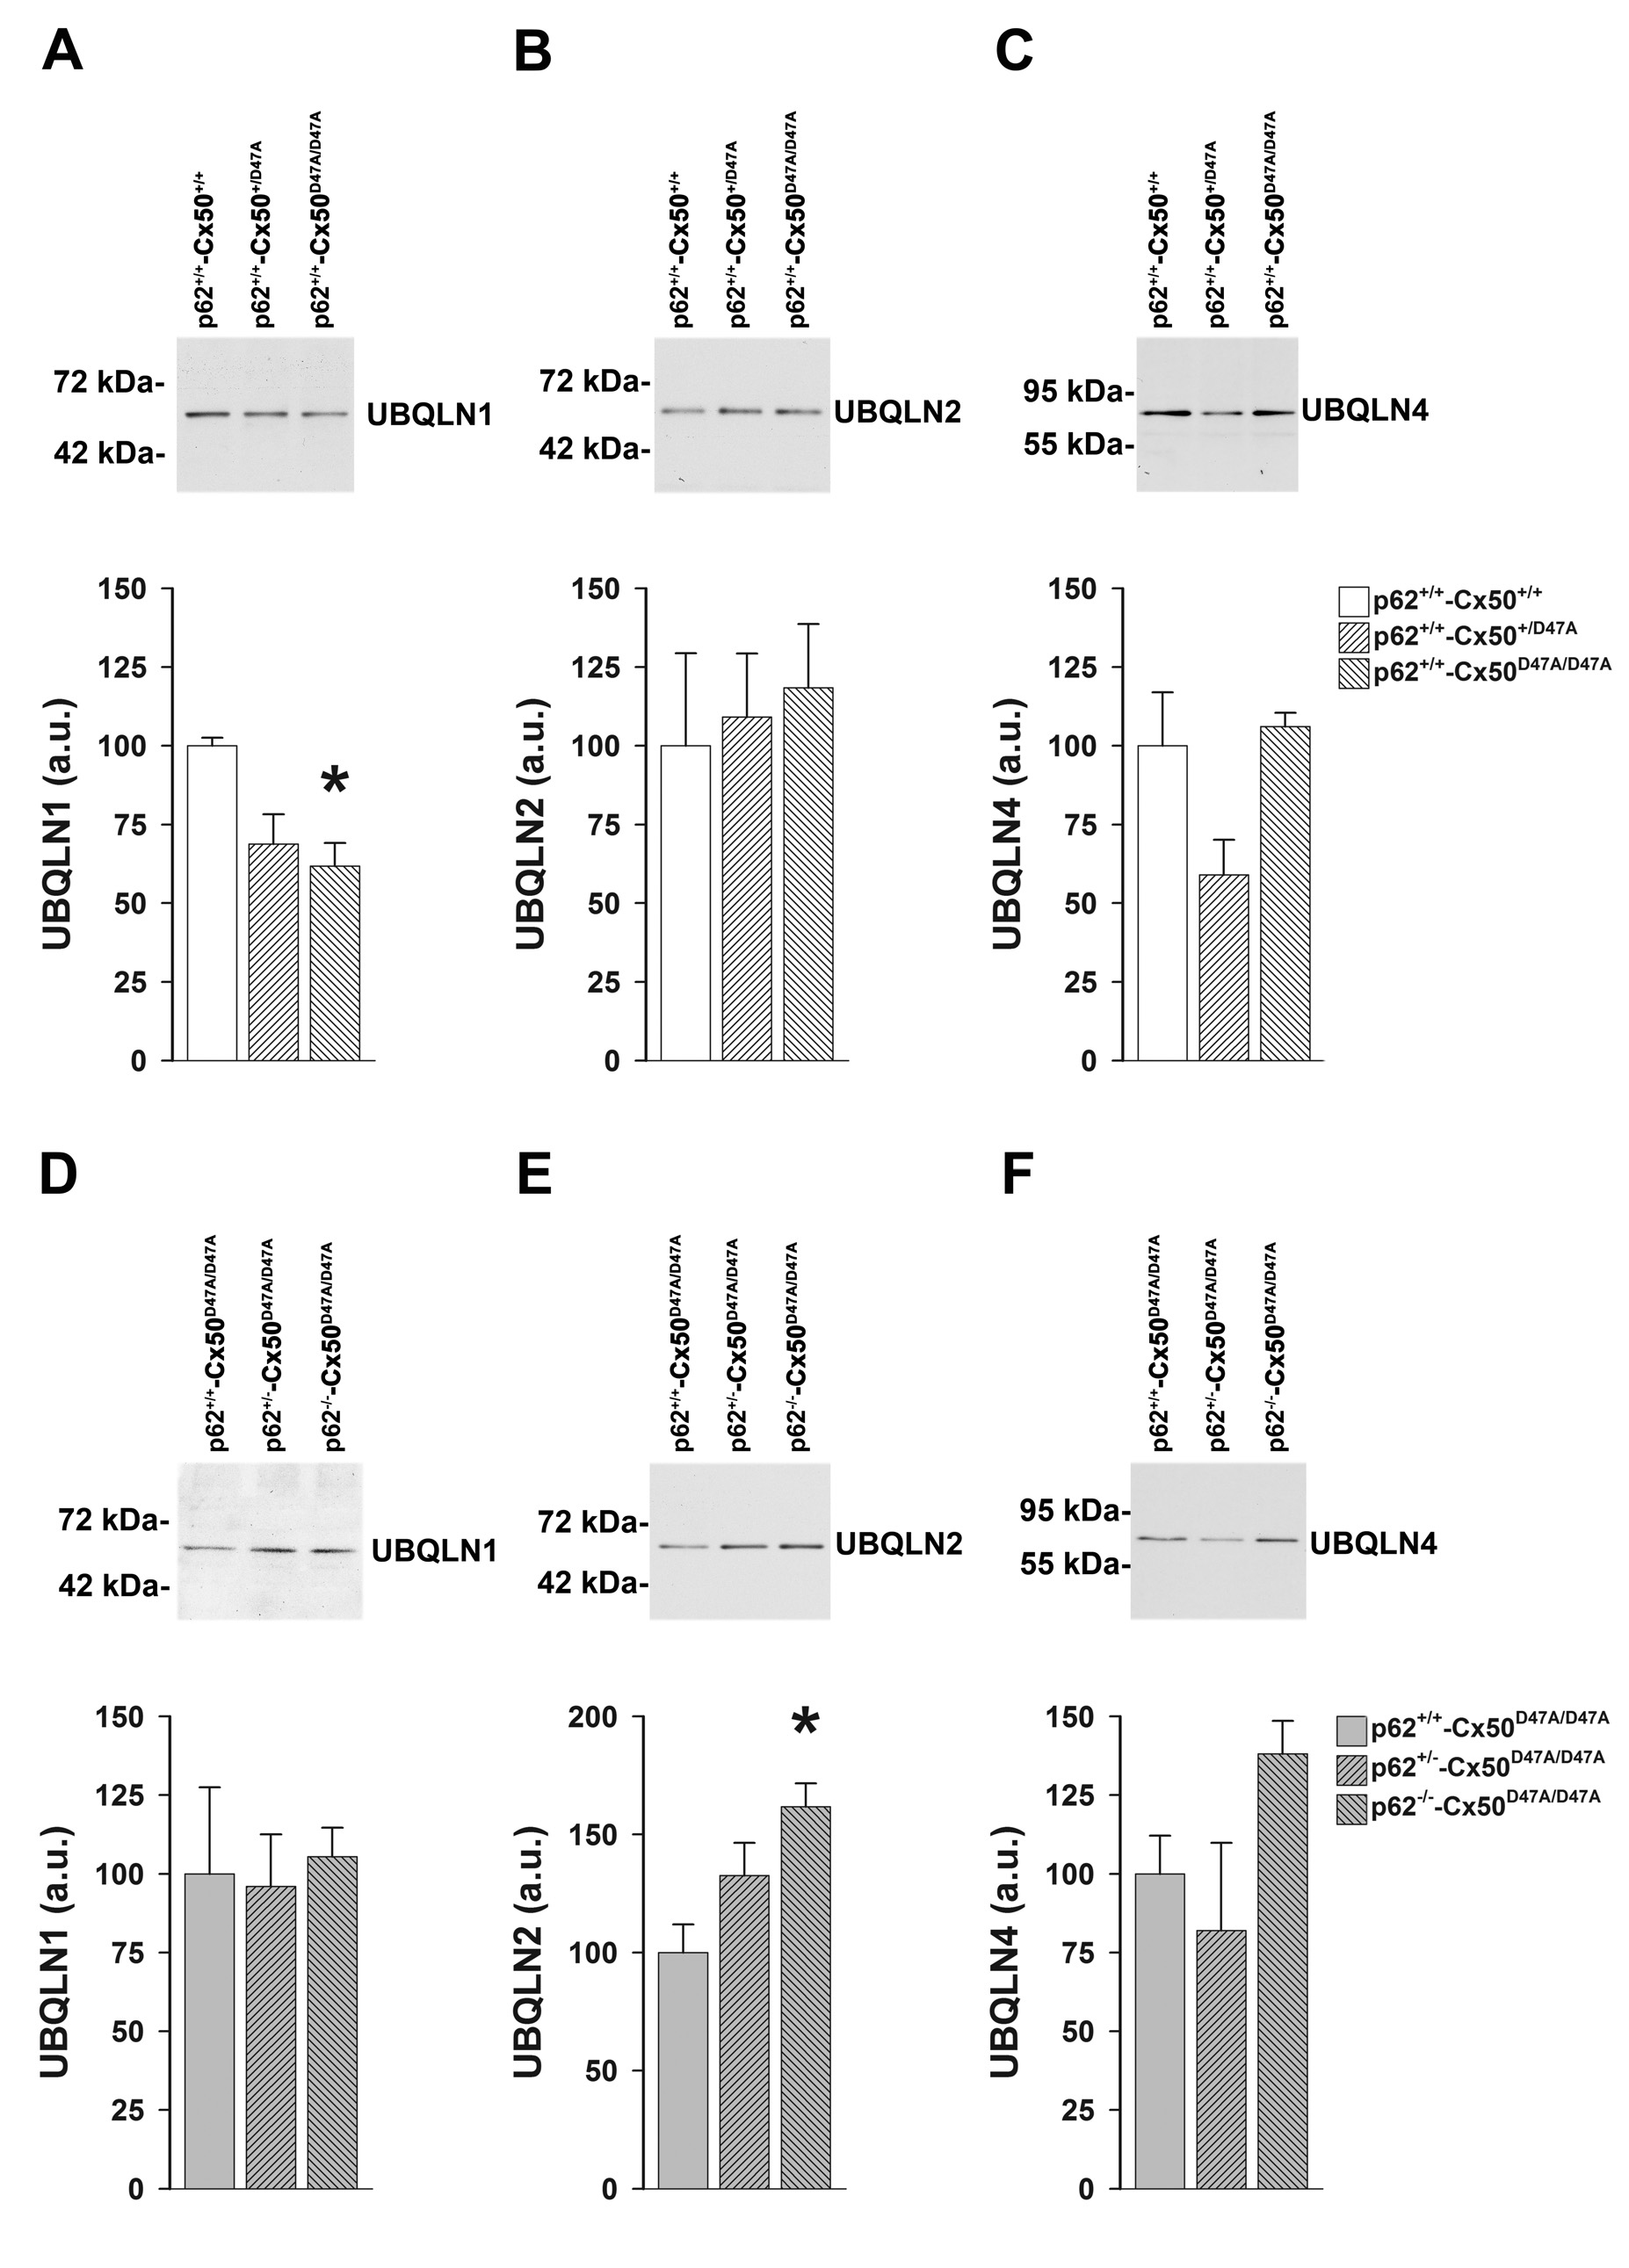
 Figure 7 of
Jara, Mol Vis 2020; 26:204-215.
Figure 7 of
Jara, Mol Vis 2020; 26:204-215.