Figure 1. Levels of total p62 and its phosphorylated forms are altered in lenses of homozygous Cx50D47A mice. A–C: Representative immunoblots show levels of total p62 (A), p62 phosphorylated at threonine-269/serine-272 (P-p62(T269/S272) (B), and p62 phosphorylated at serine-349 (P-p62(S349) (C) in lens homogenates prepared from 1-month-old wild-type, or heterozygous or homozygous Cx50D47A mice. The migration positions
of the molecular mass markers are indicated on the left. D: The graph shows the densitometric values of the immunoreactive bands of total p62. Data are presented as the mean (bar)
+ standard error of the mean (SEM; n = 6 sets) in arbitrary units (a.u.). E, F: The graphs show the ratio of p62 phosphorylated at T269/S272 to total p62 (E) and the ratio of p62 phosphorylated at S349 to total p62 (F) calculated from the densitometric values of the immunoreactive bands. Data are presented as the mean (bar) + SEM; n = 6
sets for P-p62(T269/S272), and n = 3 sets for P-p62(S349). Asterisks denote statistically significant differences from wild-type
lenses (p<0.05).
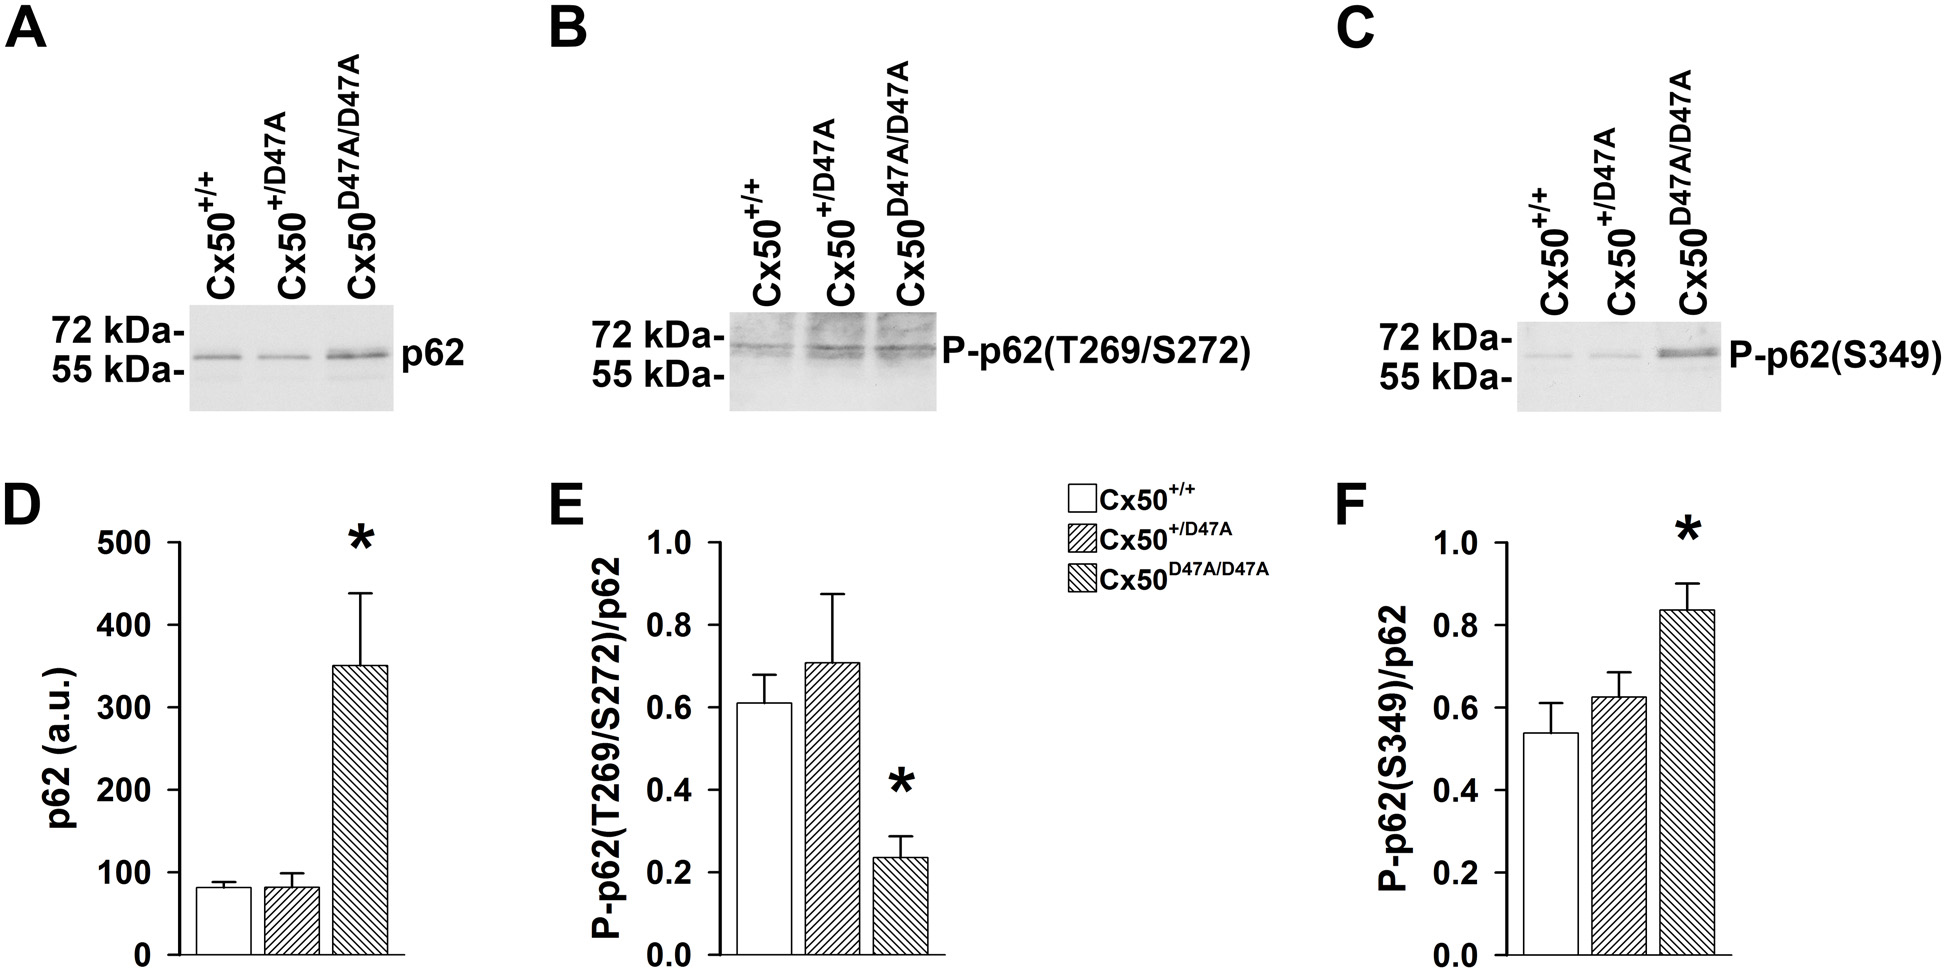
 Figure 1 of
Jara, Mol Vis 2020; 26:204-215.
Figure 1 of
Jara, Mol Vis 2020; 26:204-215.