Figure 3. Intracellular signaling involved in osmotic and hypoxic expression of the OPN gene in RPE cells. The level of OPN mRNA was determined with real-time RT–PCR in cells cultured for 24 h in iso- (control; A) and hyperosmotic (+ 100 mM NaCl) media (B), and in the presence of CoCl2 (150 µM; C), respectively. The following agents were tested: the inhibitor of p38 MAPK activation, SB203580 (10 µM), the inhibitor of
ERK1/2 activation, PD98059 (20 µM), the JNK inhibitor SP600125 (10 µM), the inhibitor of PI3K-related kinases, LY294002 (5
µM), the JAK2 Inhibitor AG490 (10 µM), the inhibitor of protein kinase Cα/β, Gö6976 (1 µM), the inhibitor of store-operated
calcium entry channels, inositol trisphosphate receptors, and transient receptor potential channels, 2-aminoethoxydiphenyl
borate (2-APB; 100 μM), the protein kinase A inhibitor H-89 (1 µM), the inhibitor of Src tyrosine kinases, PP2 (100 nM), the
reducing agent dithiothreitol (DTT; 3 mM), the PLA2 inhibitor 4-bromophenacyl bromide (Bromo; 300 µM), the pan-caspase inhibitor z-VAD (30 µM), the caspase-1 inhibitor Ac-YVAD-CMK
(YVAD; 500 nM), the inhibitor of programmed necrosis, necrostatin-1 (Nec-1; 30 µM), inactive necrostatin-1 (Nec-1i; 30 µM)
which was tested as negative control, the caspase-3 inhibitor Ac-DEVD-CHO (DEVD; 100 µM), and the caspase-8 inhibitor Ac-IETD-CHO
(IETD; 100 µM). Vehicle control was made with dimethyl sulfoxide (DMSO; 1:1000). The numbers of independent experiments using
cell lines from different donors are indicated in the bars. Statistically significant difference versus unstimulated control:
*p<0.05. Statistically significant difference versus NaCl control: ●p<0.05. Statistically significant difference versus CoCl2 control: ○p<0.05.
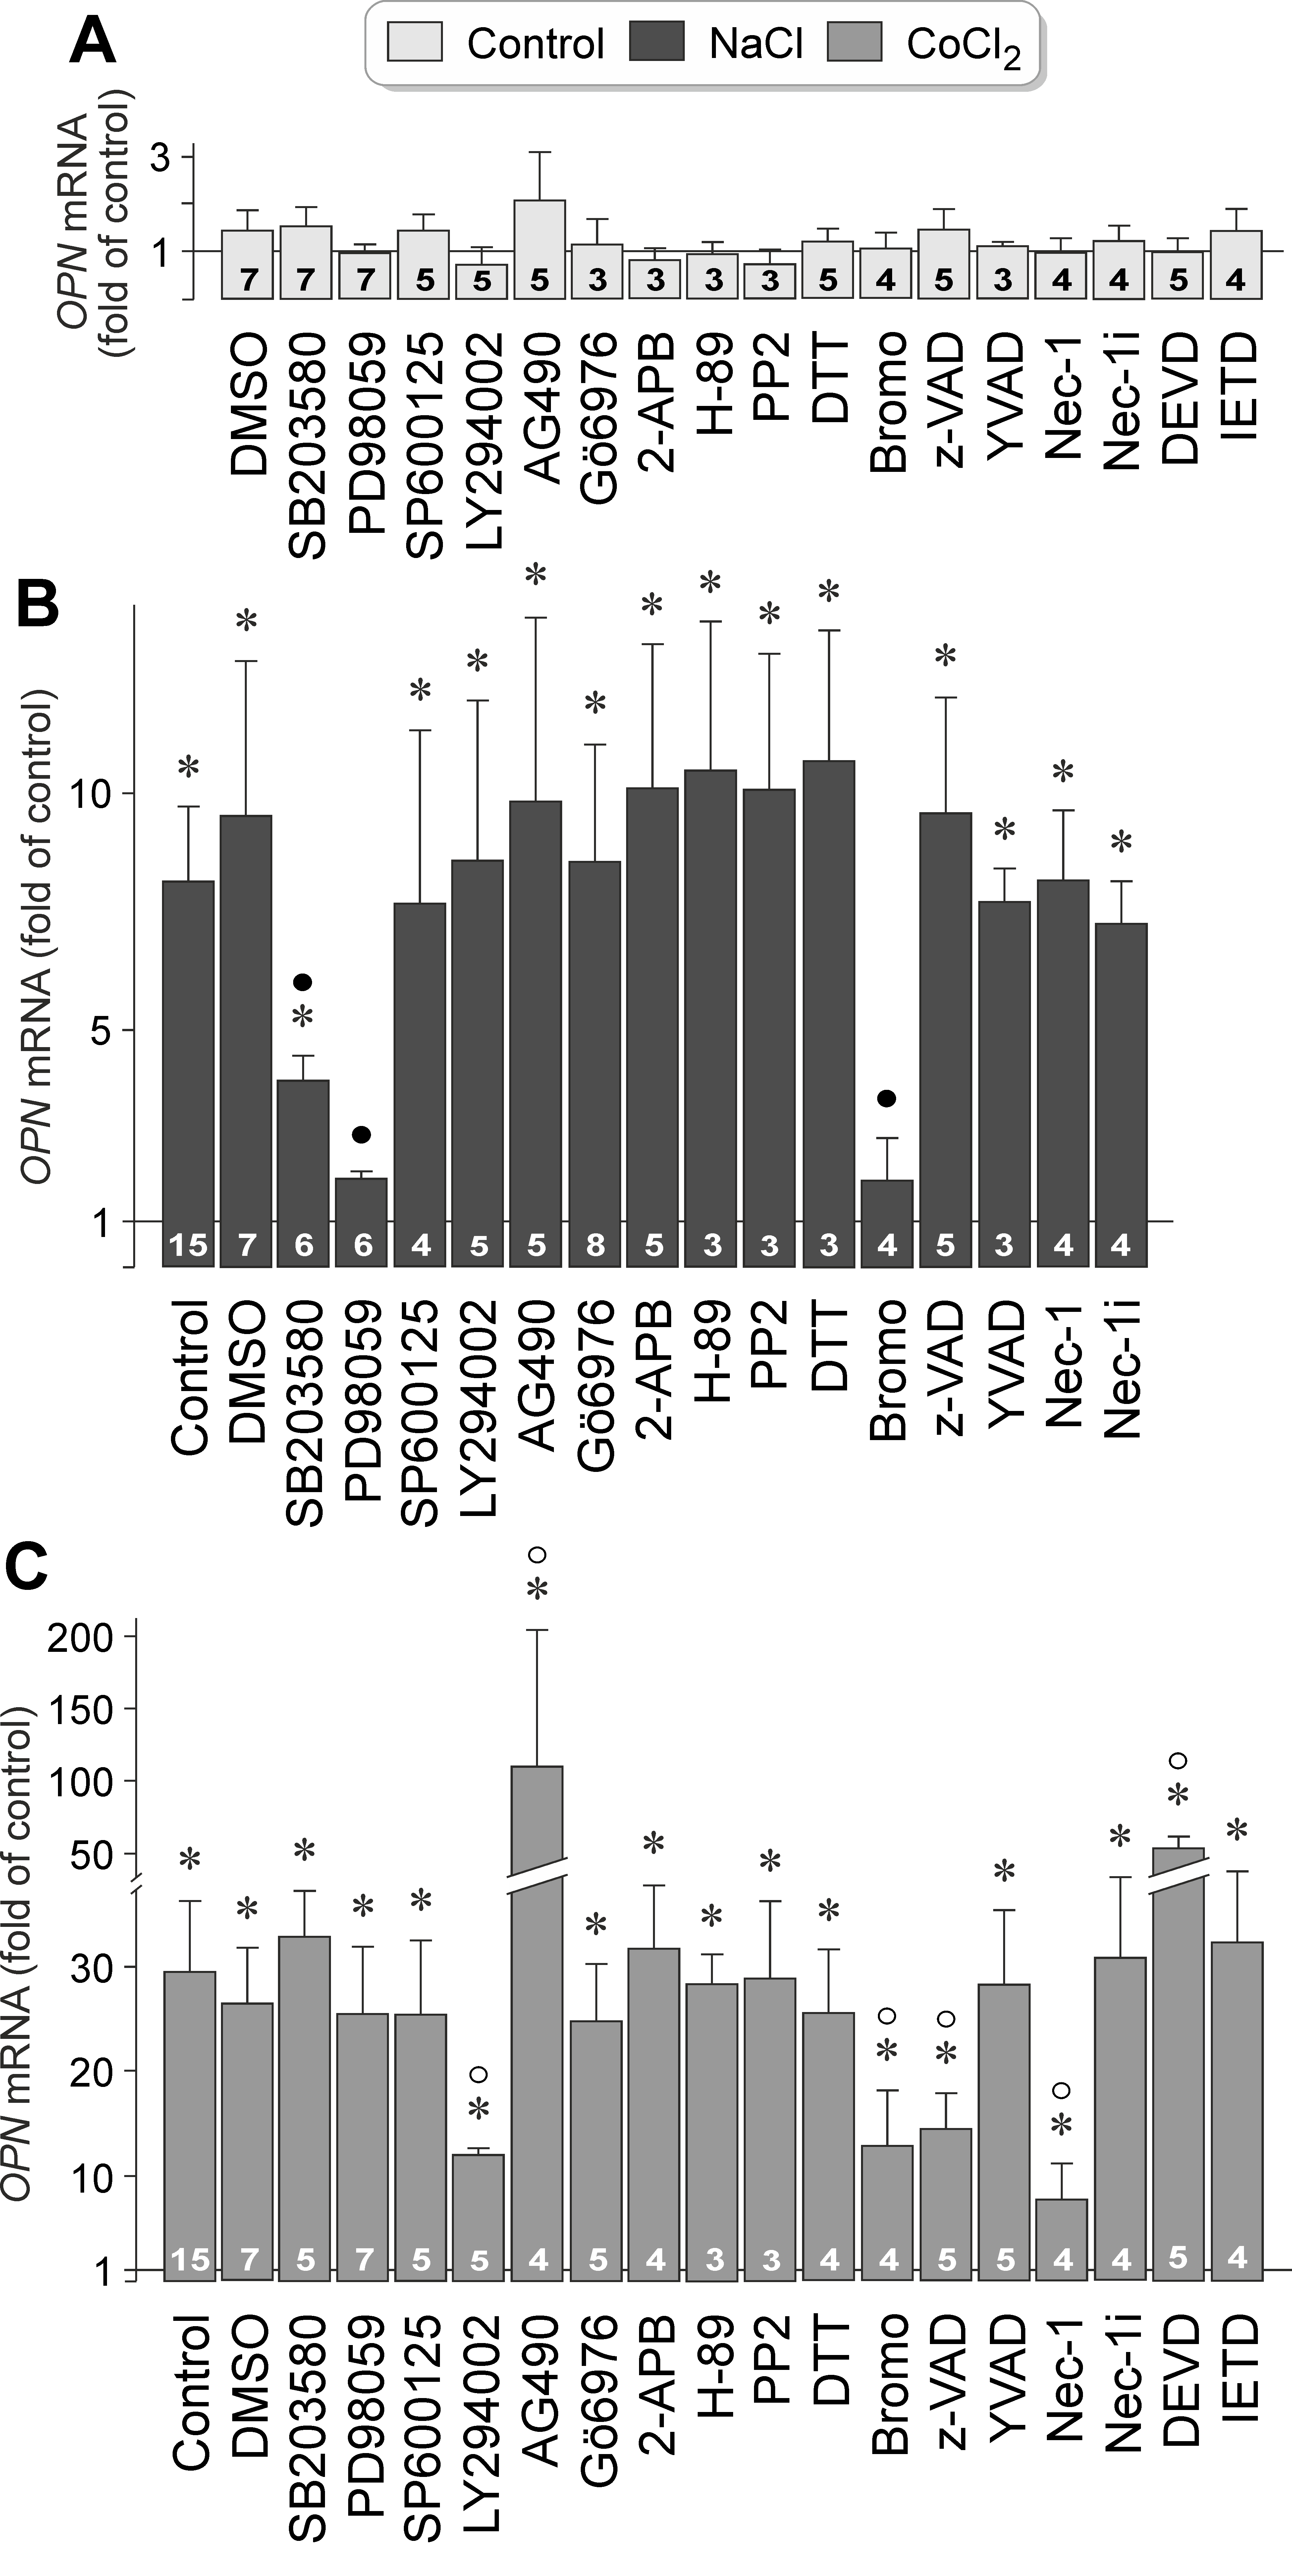
 Figure 3 of
Hollborn, Mol Vis 2020; 26:188-203.
Figure 3 of
Hollborn, Mol Vis 2020; 26:188-203.