Figure 2. OPN protein in cultured RPE cells. A: Cell cultures were immunolabeled with an antibody against OPN (red). The cell nuclei were stained with 4’,6-diamidino-2-phenylindole
(DAPI; blue). The cells were cultured for 24 h under unstimulated control conditions and in the presence of high (+ 100 mM)
NaCl and the hypoxia mimetic CoCl2 (150 µM), respectively. B: Double-immunolabeling of OPN (red) and cytokeratin (green). C: OPN secretion from RPE cells. The OPN protein level was determined with enzyme-linked immunosorbent assay (ELISA) in the
media of cells cultured for 24 h in the presence of high (+ 100 mM) NaCl, sucrose (200 mM), and CoCl2 (150 µM). The data are expressed as percent of unstimulated control (100%). The numbers of independent experiments using
cell lines from different donors are indicated in the bars. Statistically significant difference versus unstimulated control:
*p<0.05. Scale bars in A and B, 20 µm.
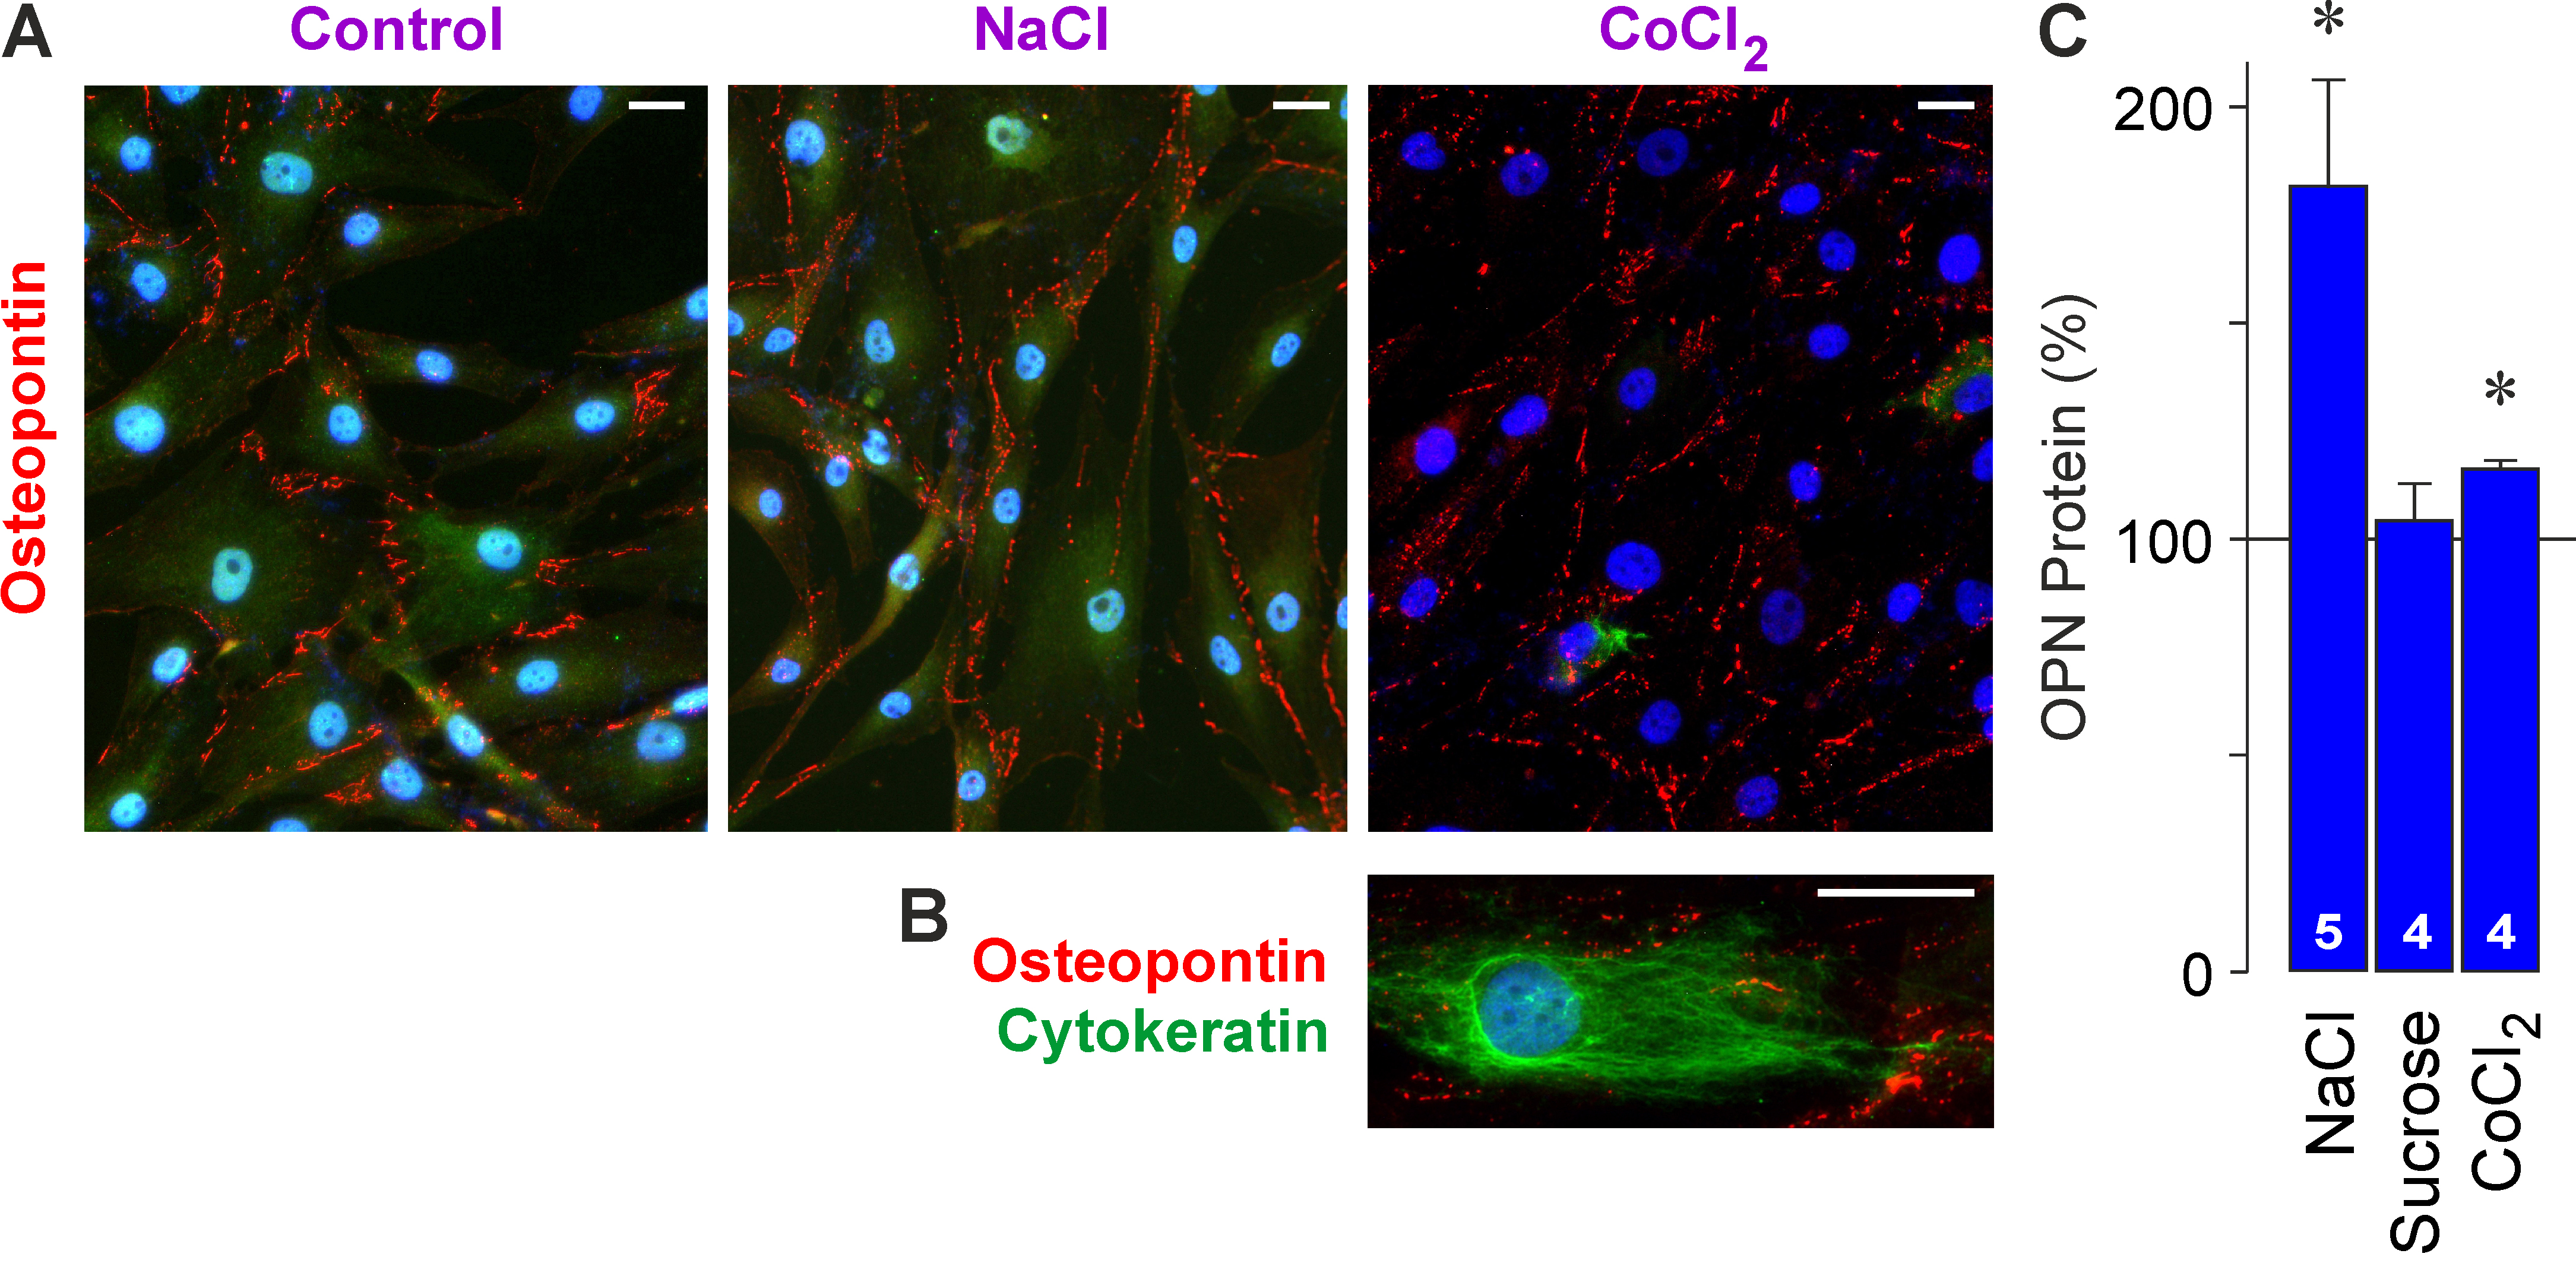
 Figure 2 of
Hollborn, Mol Vis 2020; 26:188-203.
Figure 2 of
Hollborn, Mol Vis 2020; 26:188-203.