Figure 1. Regulation of OPN gene expression and OPN secretion in RPE cells. A: Presence of OPN gene transcripts in RPE cells. To confirm the correct lengths of the PCR products, agarose gel electrophoresis was performed
using products obtained from acutely isolated RPE cells (a) and cultured RPE cell lines (c) derived from different post-mortem
donors. Negative controls (0) were performed by adding double-distilled water instead of cDNA as the template. The β-actin
(ACTB) mRNA level was used to normalize the OPN mRNA level in real-time reverse transcription (RT)–PCR. B: Expression level of the OPN gene in acutely isolated RPE cells and cultured RPE cell lines, as revealed with real-time RT–PCR. Each bar represents the
cycle number necessary for the detection of the transcript. C‒F: The OPN mRNA level in cultured RPE cell lines was determined with real-time RT–PCR after stimulation of the cells for 2, 6, and 24
h (as indicated by the panels of the bars), and is expressed as the fold of unstimulated control. C: Effects of chemical hypoxia and cell culture in a 0.25% O2 atmosphere on OPN gene expression. Chemical hypoxia was induced with the addition of CoCl2 (150 µM) to the culture medium. D: Effects of hyperglycemia induced by the addition of high (25 mM) glucose, extracellular hyperosmolarity induced by the addition
of high (+ 100 mM) NaCl and sucrose (200 mM), respectively, and extracellular hypoosmolarity (60% osmolarity) on OPN gene expression. E: Dose-dependence of the effect of high extracellular NaCl on the OPN mRNA level. Ten millimoles to 100 mM NaCl were added to the culture medium, as indicated in the bars. Data were obtained
in six independent experiments using cell lines from different donors. F: Effects of inflammatory and growth factors on the expression of the OPN gene. The following factors were tested: VEGF, bFGF, HB-EGF, PDGF-BB, TGF-β1, HGF, PlGF, IL-1β, and TNFα (each at 10 ng/ml).
In addition, fetal calf serum (10%) was tested. G: Effects of purinergic receptor agonists on the expression of the OPN gene. The following agents were tested: ATP (50 µM), UTP (50 µM), the selective P2Y1 agonist MRS2365 (200 nM), the selective P2Y2 agonist MRS2768 (100 µM), adenosine (50 µM), and the selective A1 agonist 2’-MeCCPA (100 nM). H: Presence of CD44 gene transcripts in RPE cells. Agarose gel electrophoresis was performed using products obtained from cultured RPE cell lines
derived from different donors (1‒3). Negative controls (0) were performed by adding double-distilled water instead of cDNA
as the template. I: Effects of a hyperosmotic medium (+ 100 mM NaCl) and chemical hypoxia induced with the addition of CoCl2 (150 µM) on the expression of the CD44 gene. The numbers of independent experiments using cell lines from different donors are indicated in or above the bars. Statistically
significant difference between acutely isolated and cultured cells: ●p<0.05. Statistically significant difference versus unstimulated control: *p<0.05.
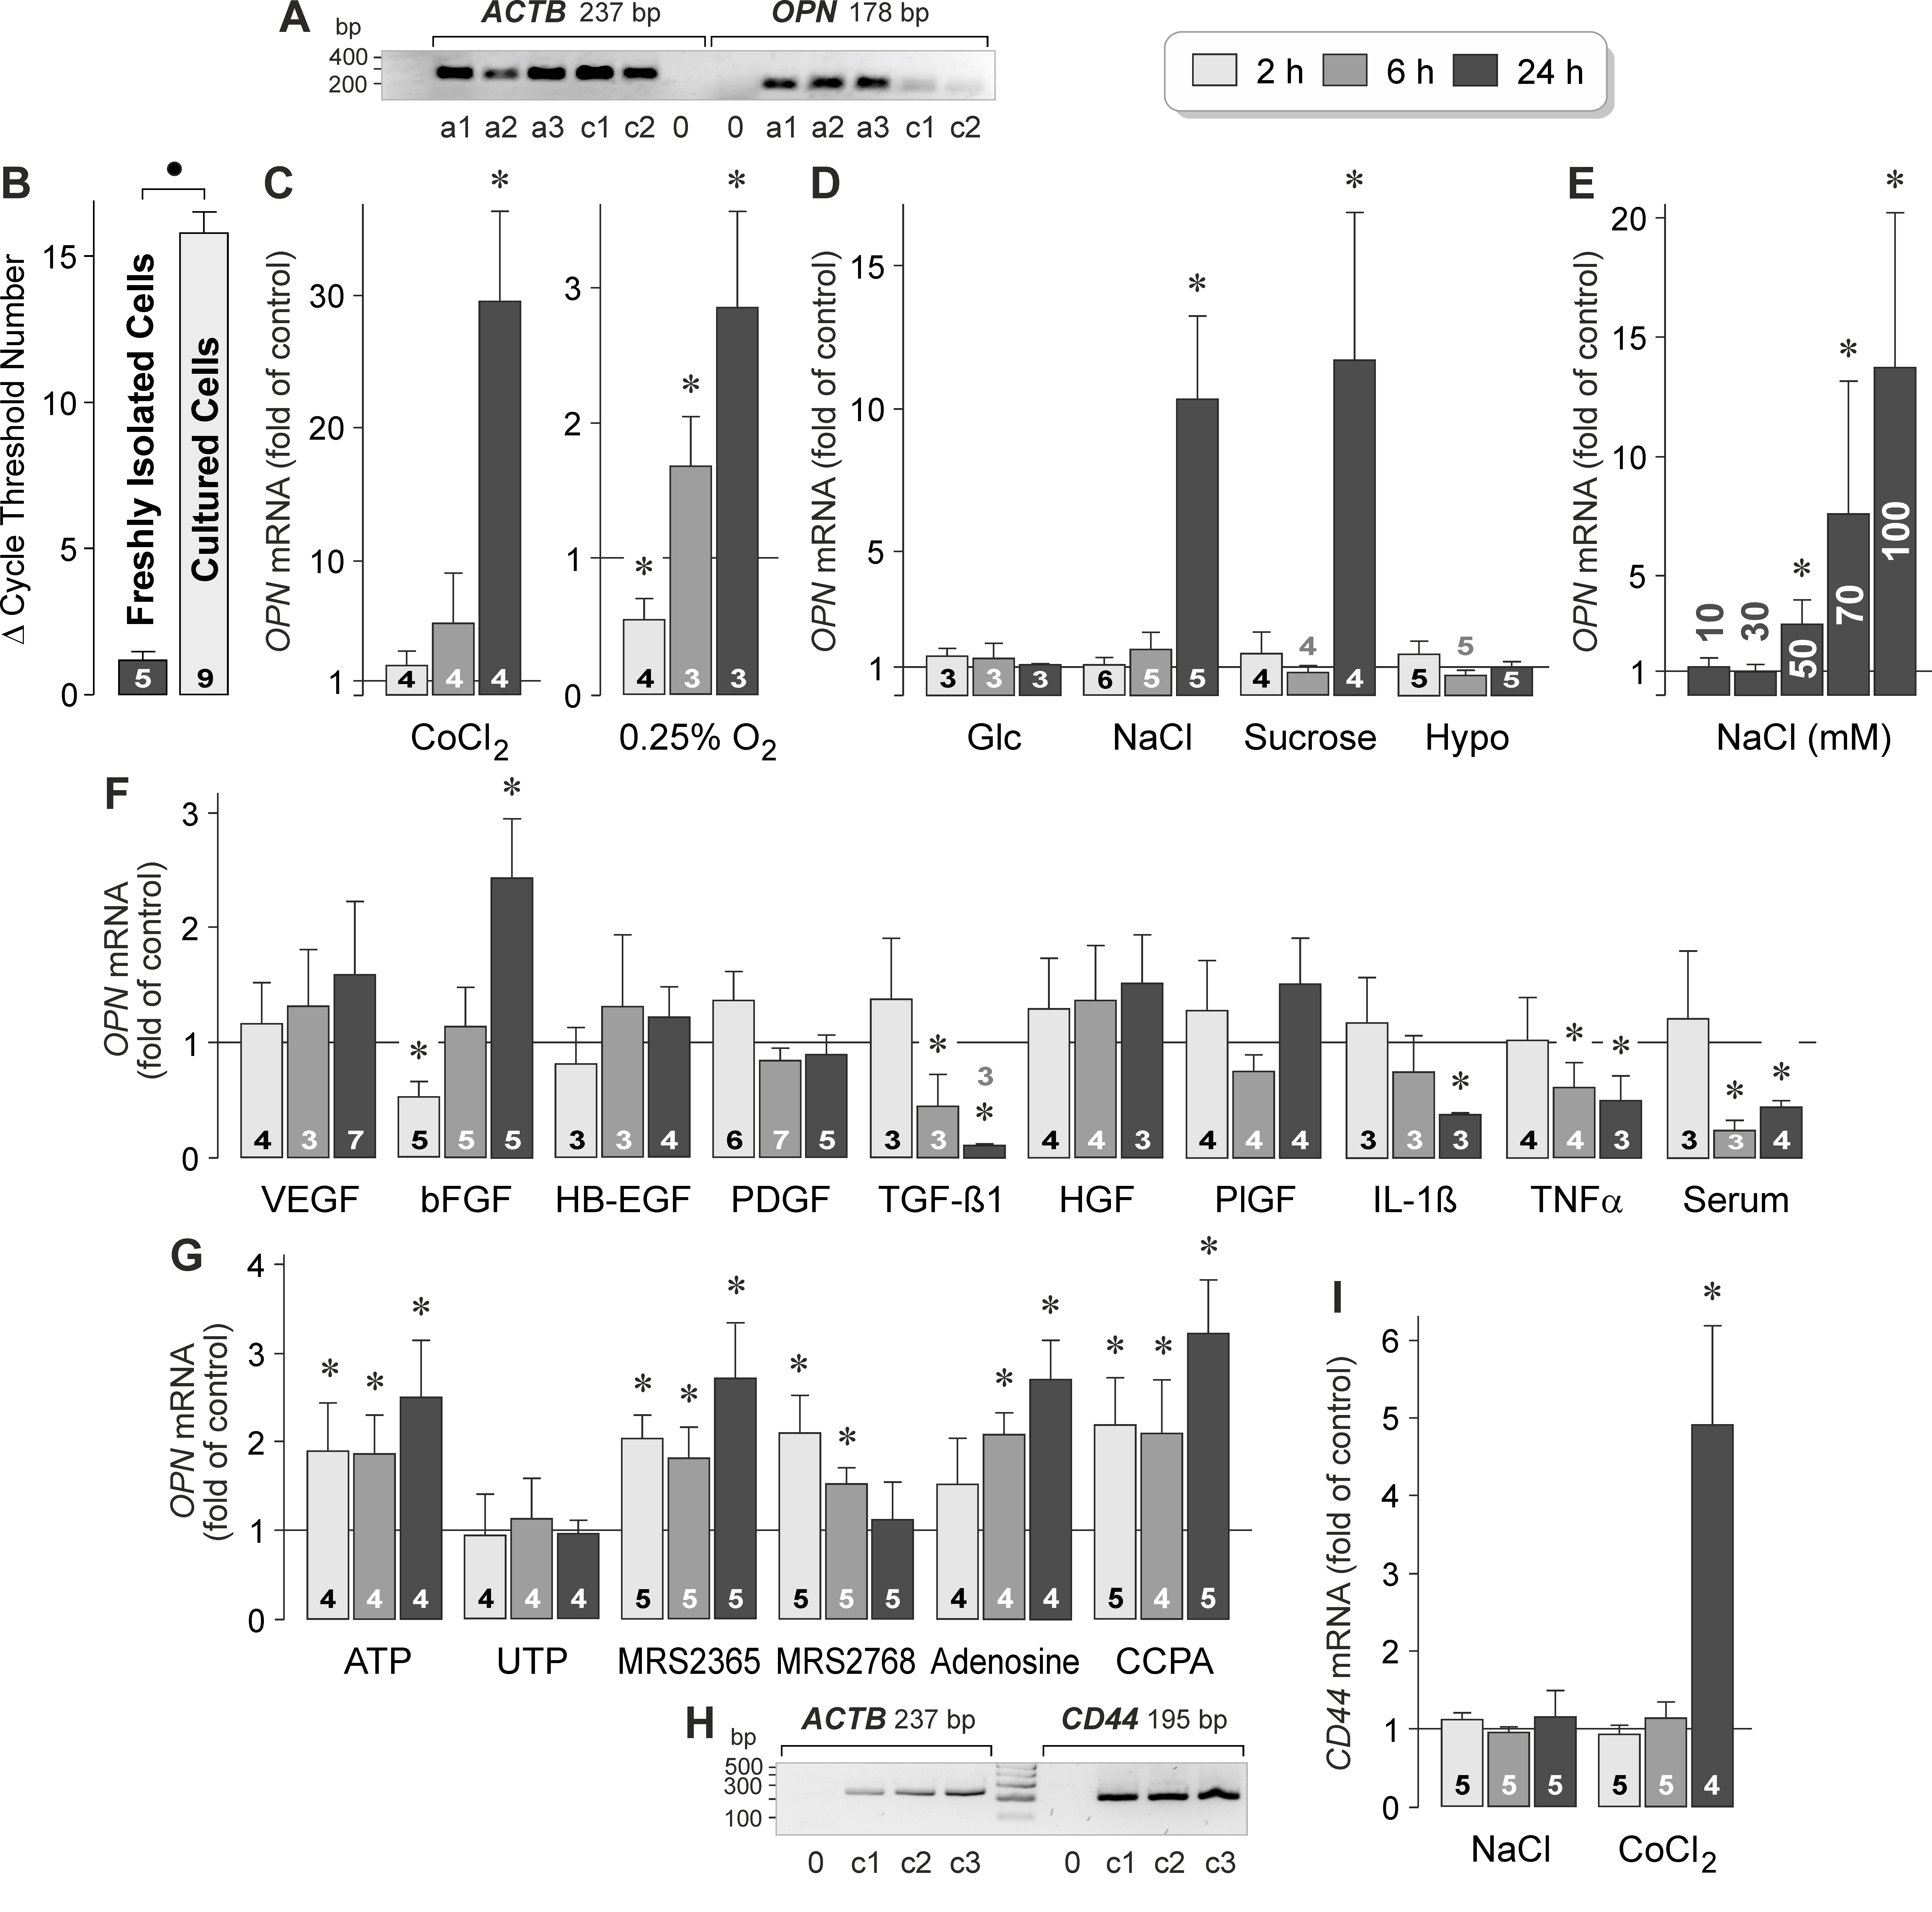
 Figure 1 of
Hollborn, Mol Vis 2020; 26:188-203.
Figure 1 of
Hollborn, Mol Vis 2020; 26:188-203.