Figure 3. Central corneal thickness was measured using optical coherence tomography (OCT) in A. B: The difference in the central corneal thickness (CCT) can be seen in the 61 BXD strains measured. C: Interval map of the CCT across the mouse genome. The total linkage related score (LRS) is indicated with a blue line. The
red line illustrates the contribution from the B6 allele and the green line the contribution from the D2 allele. Across the
top of the figure, the genome is indicated from chromosome 1 to chromosome X. On the y-axis is the LRS. Notice one statistically
significant quantitative trait locus (QTL) peak on chromosome 13 (above the pink line, p = 0.05) and additional suggestive
peaks (above the gray line). D: Mice with a null mutation in Pou6f2 (n = 6) had thinner corneas than wild-type (n = 6) littermates.
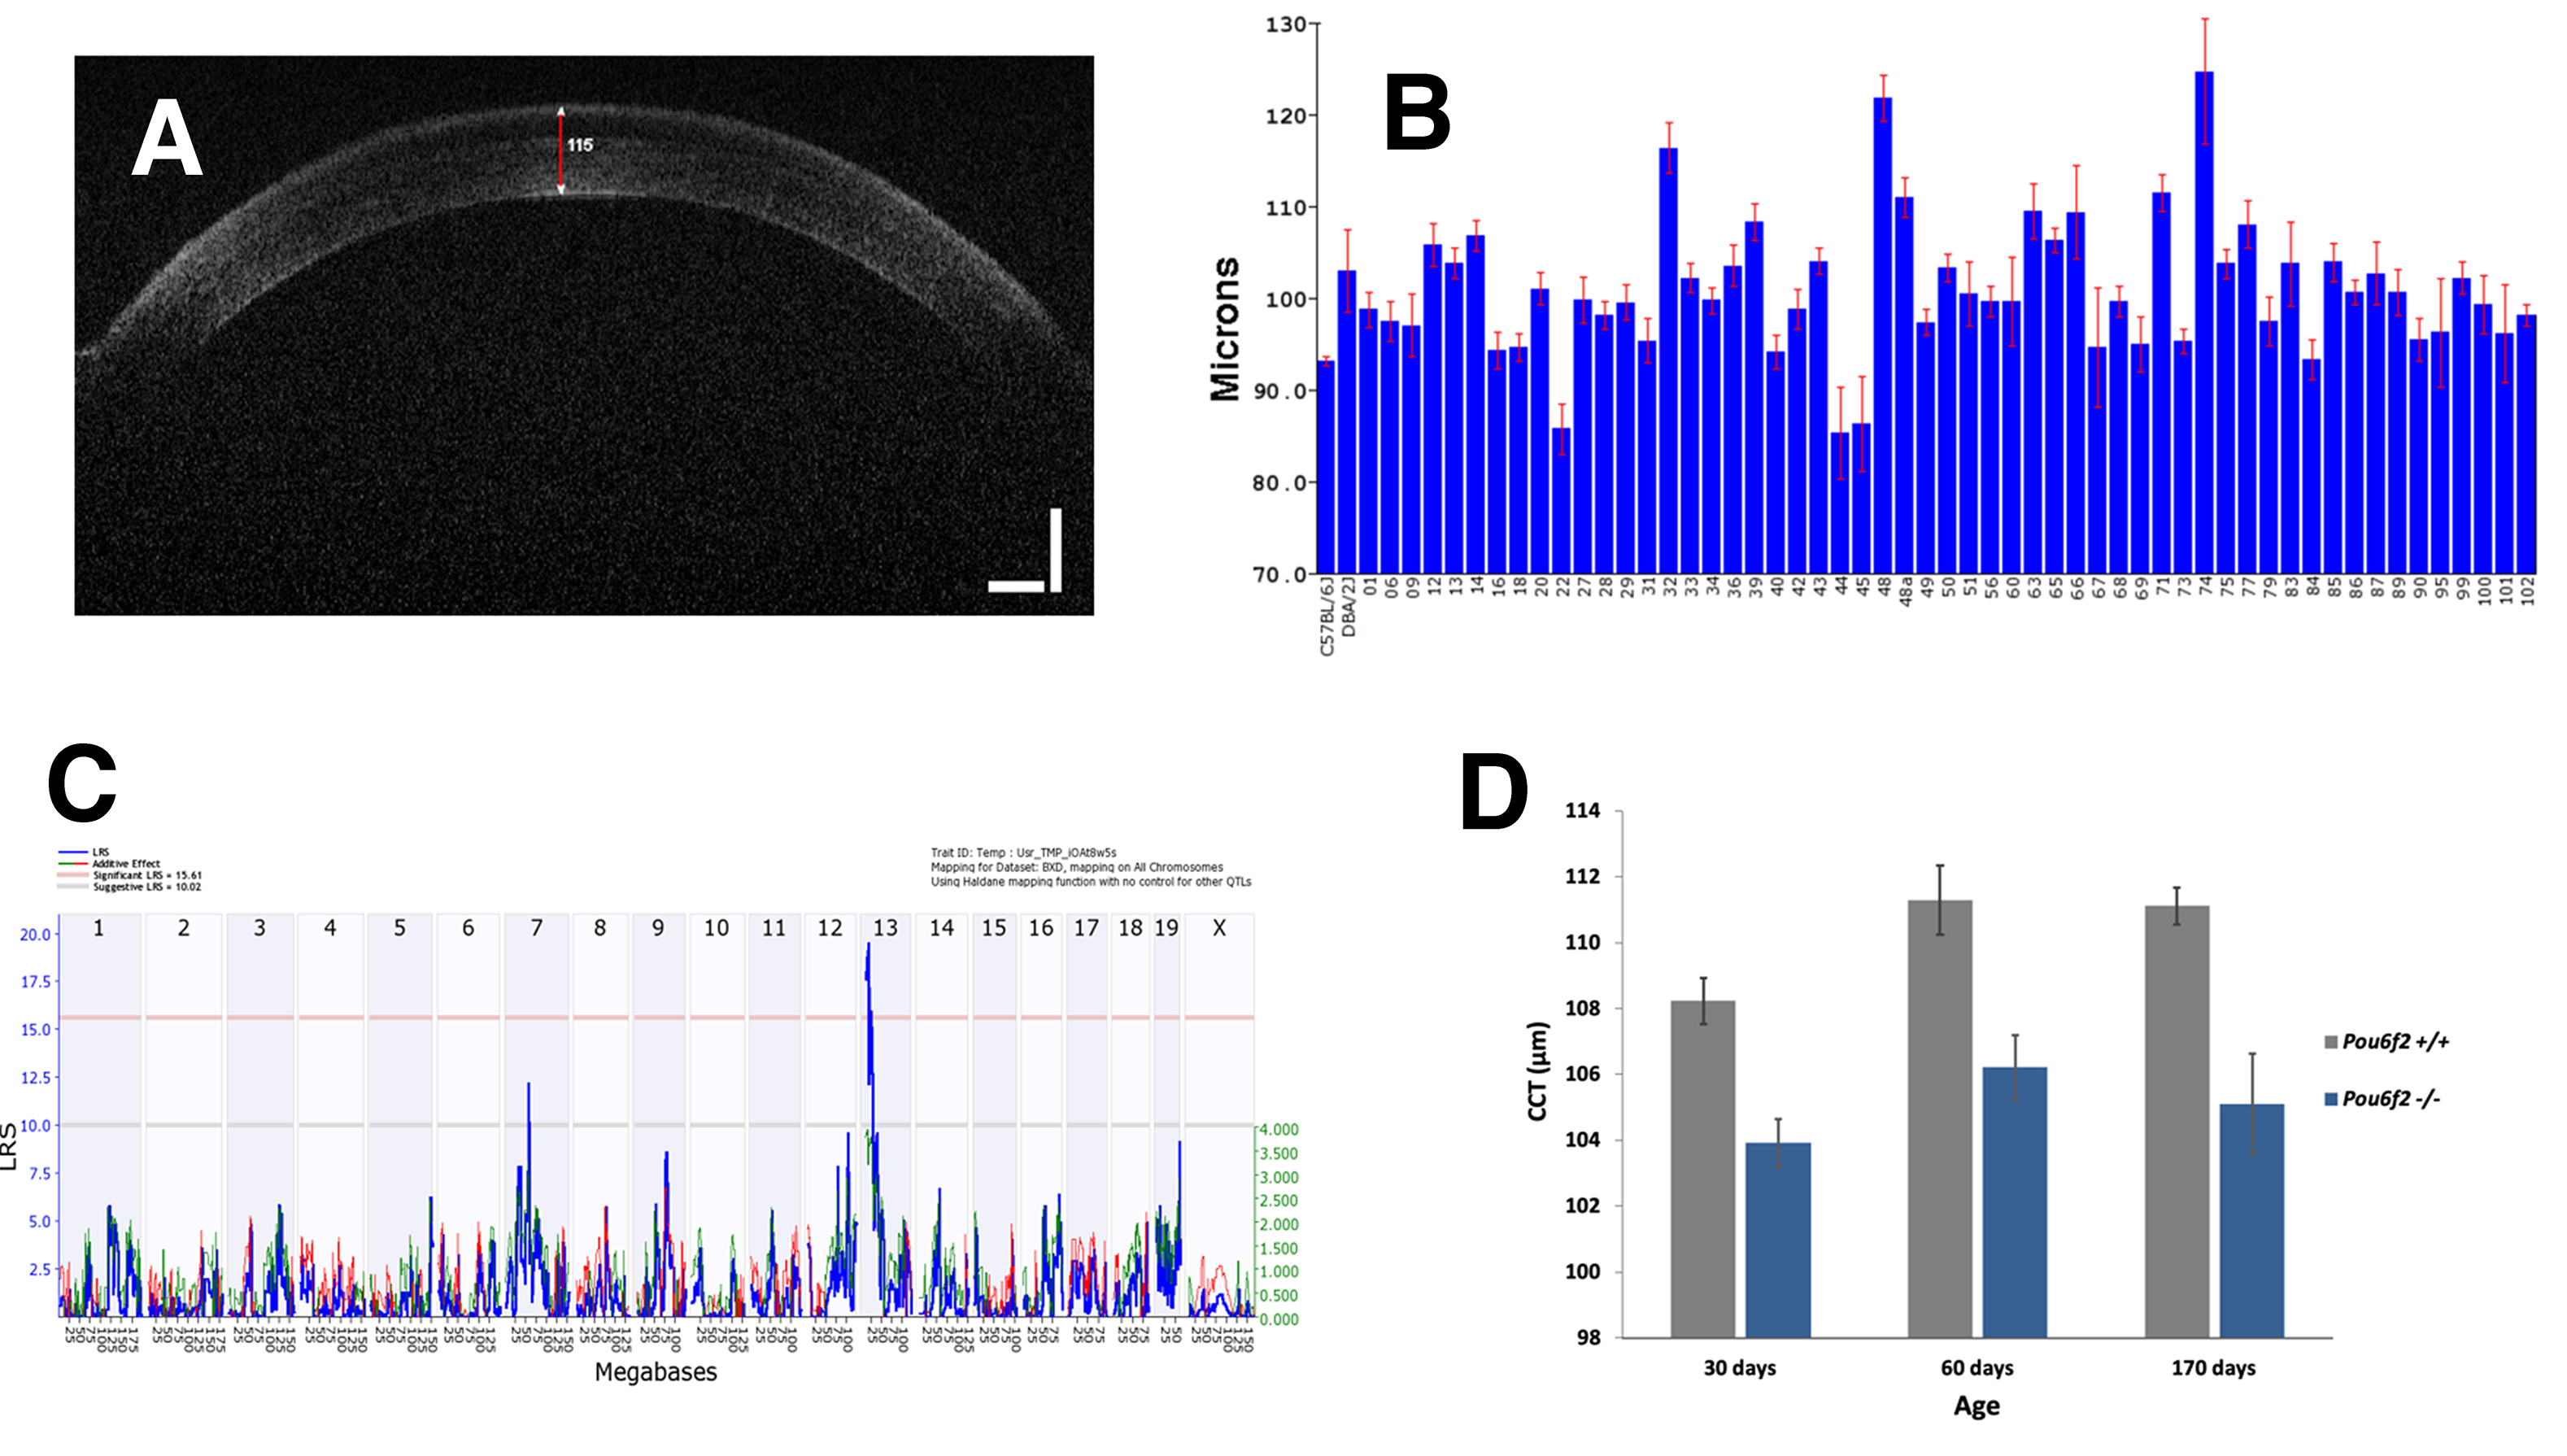
 Figure 3 of
Geisert, Mol Vis 2020; 26:173-187.
Figure 3 of
Geisert, Mol Vis 2020; 26:173-187.