Figure 2. The activation of the innate immune network following ONC is illustrated. A: Following damage to the optic nerve, the retina responds with the retinal ganglion cells undergoing degeneration and the
microglia and macroglia (astrocytes and Müller cells) responding to the insult. B: One of the responses is upregulation of components of the innate immune system. The genes that are upregulated by injury
are shown. There is also an increased correlation across the BXD strains from the healthy retina (C) to the retina 2 days after injury (D). The network map for selected genes from the innate immune system illustrates the increased correlation in the retina 2
days after optic nerve crush (ONC). In the mouse, C1q is represented by three separate genes, and all three genes (C1qa, C1qb, and C1qc) behave similarly. The colored lines indicate the Pearson correlation between the genes with the red lines representing r>0.7
and the orange lines representing r>0.5. Selected genes from the innate immune network are shown in two plots. Notice the
increased correlation in the genes of the innate immune network following ONC. These data demonstrate the power of comparing
and contrasting two different data sets: the healthy retina and the retina after ONC.
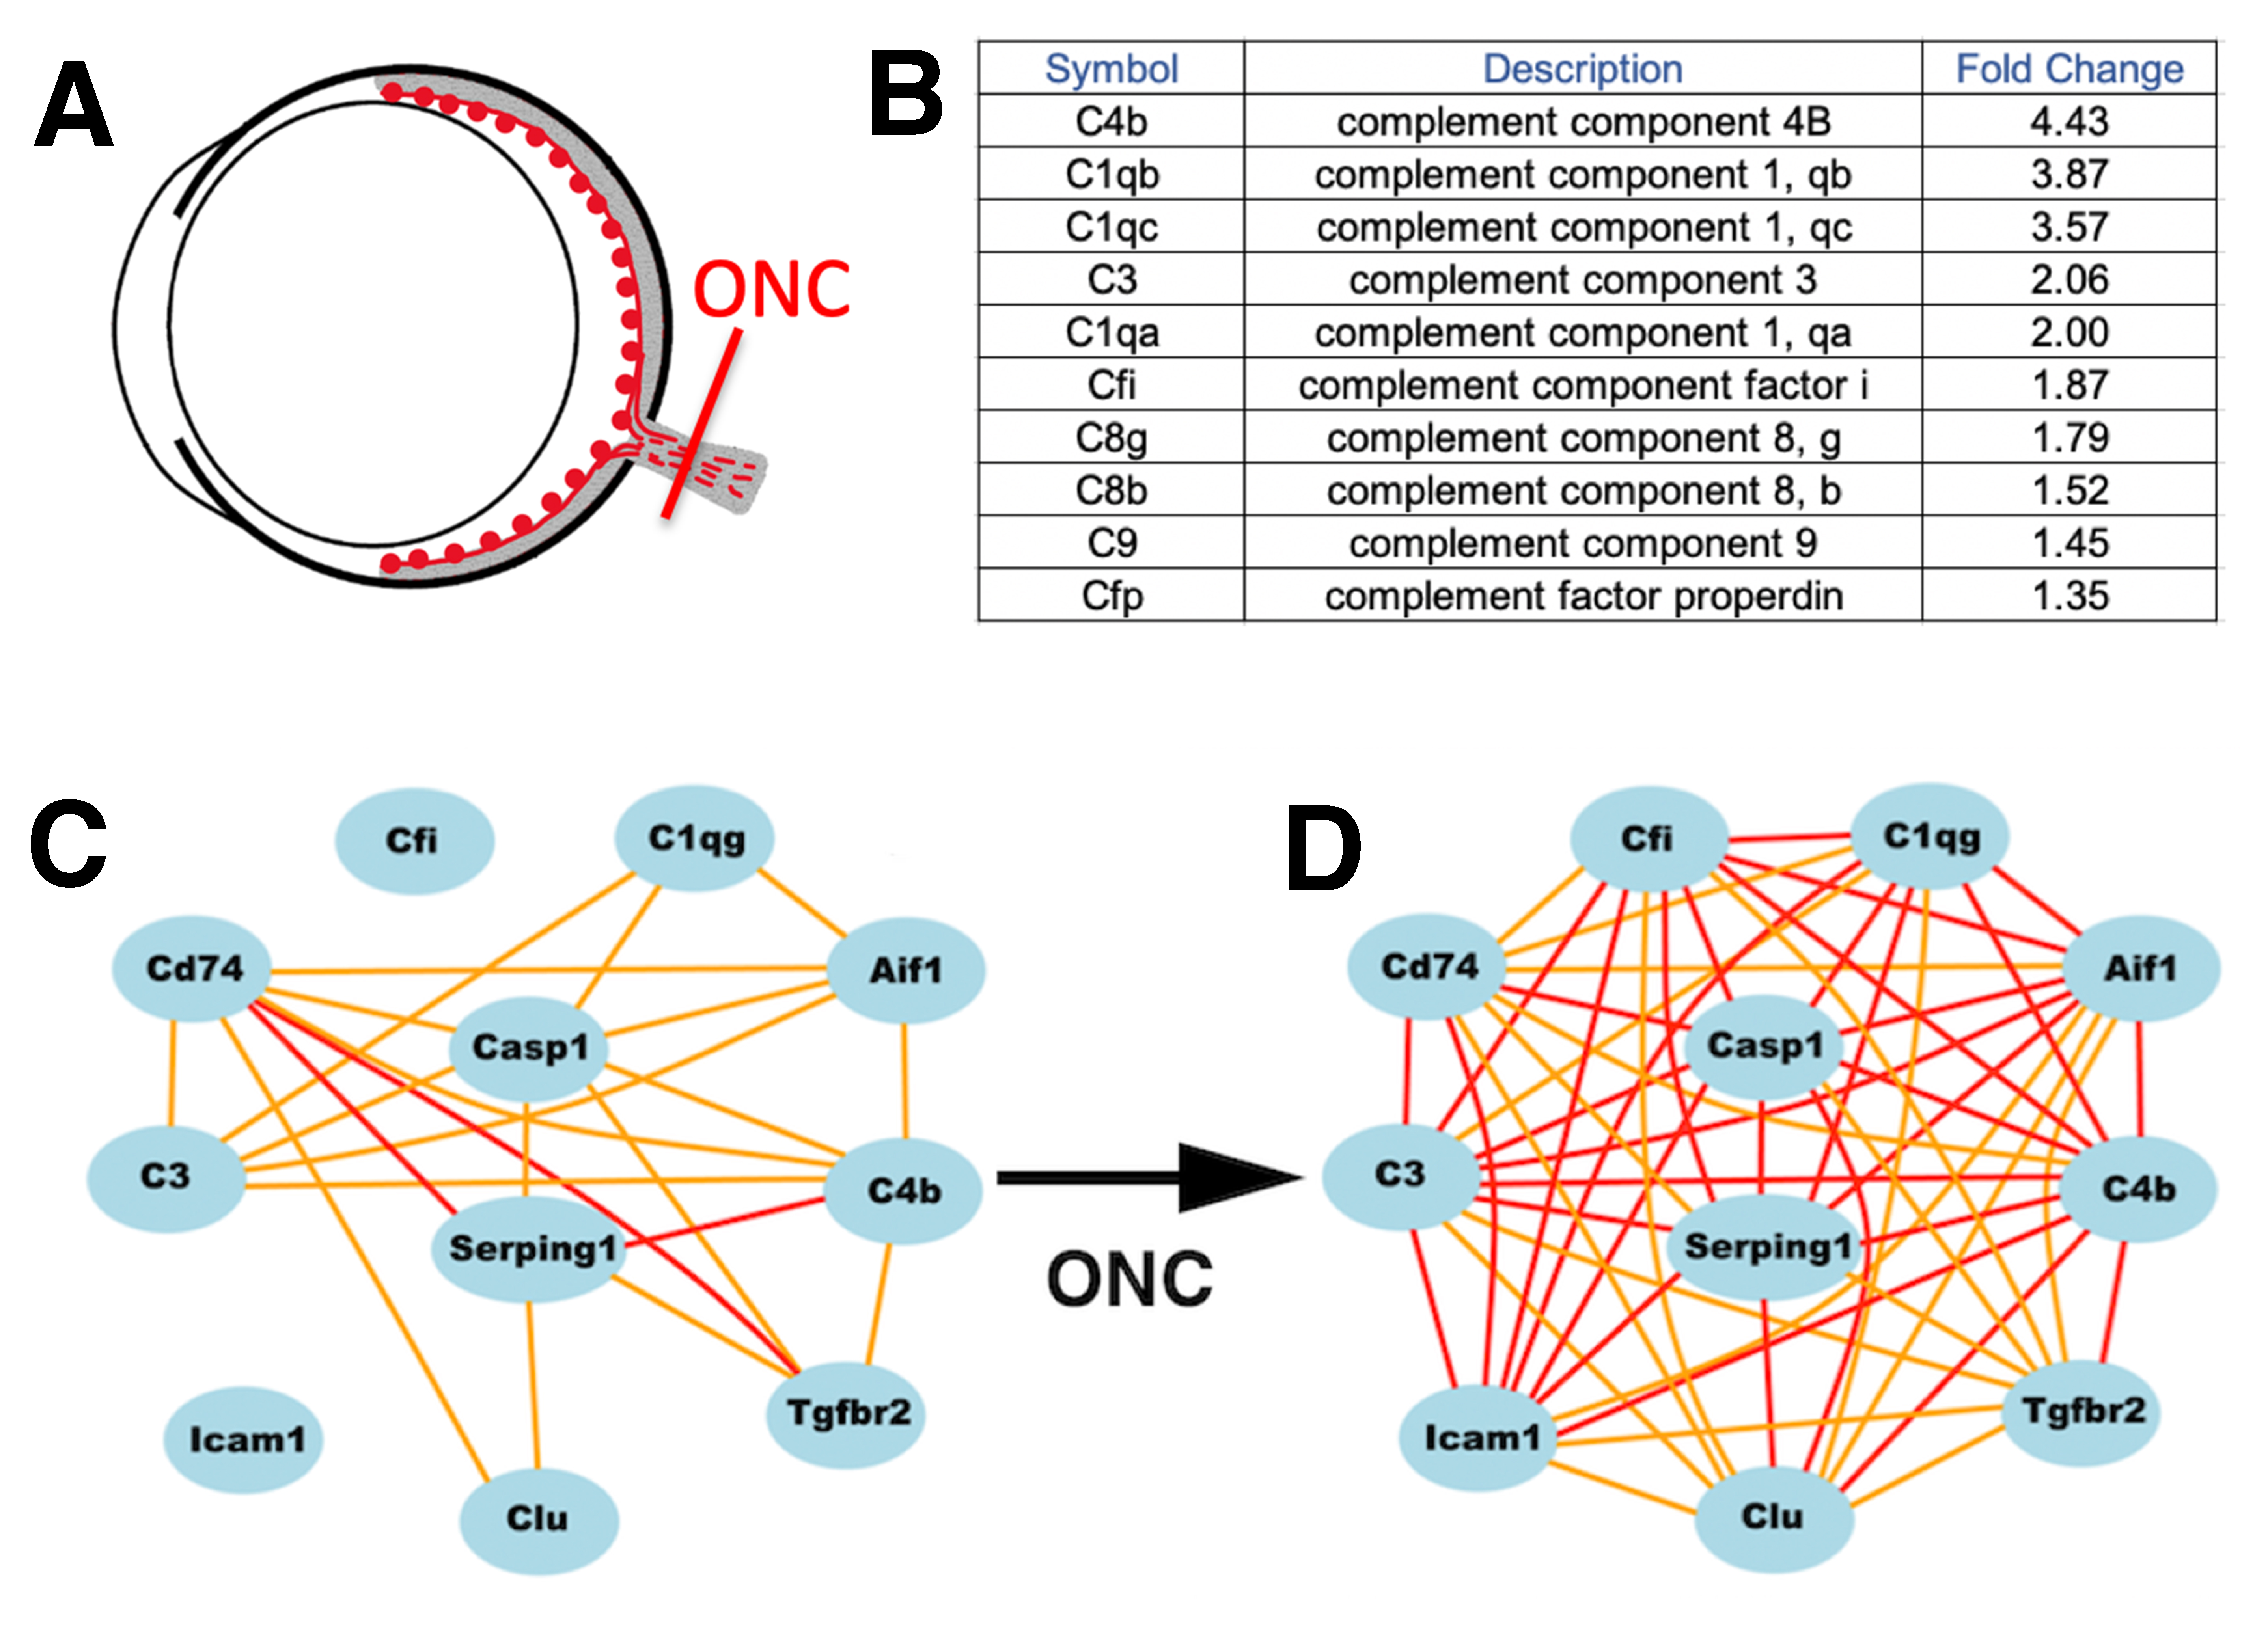
 Figure 2 of
Geisert, Mol Vis 2020; 26:173-187.
Figure 2 of
Geisert, Mol Vis 2020; 26:173-187.