Figure 7 of
Geng, Mol Vis 2020; 26:117-134.
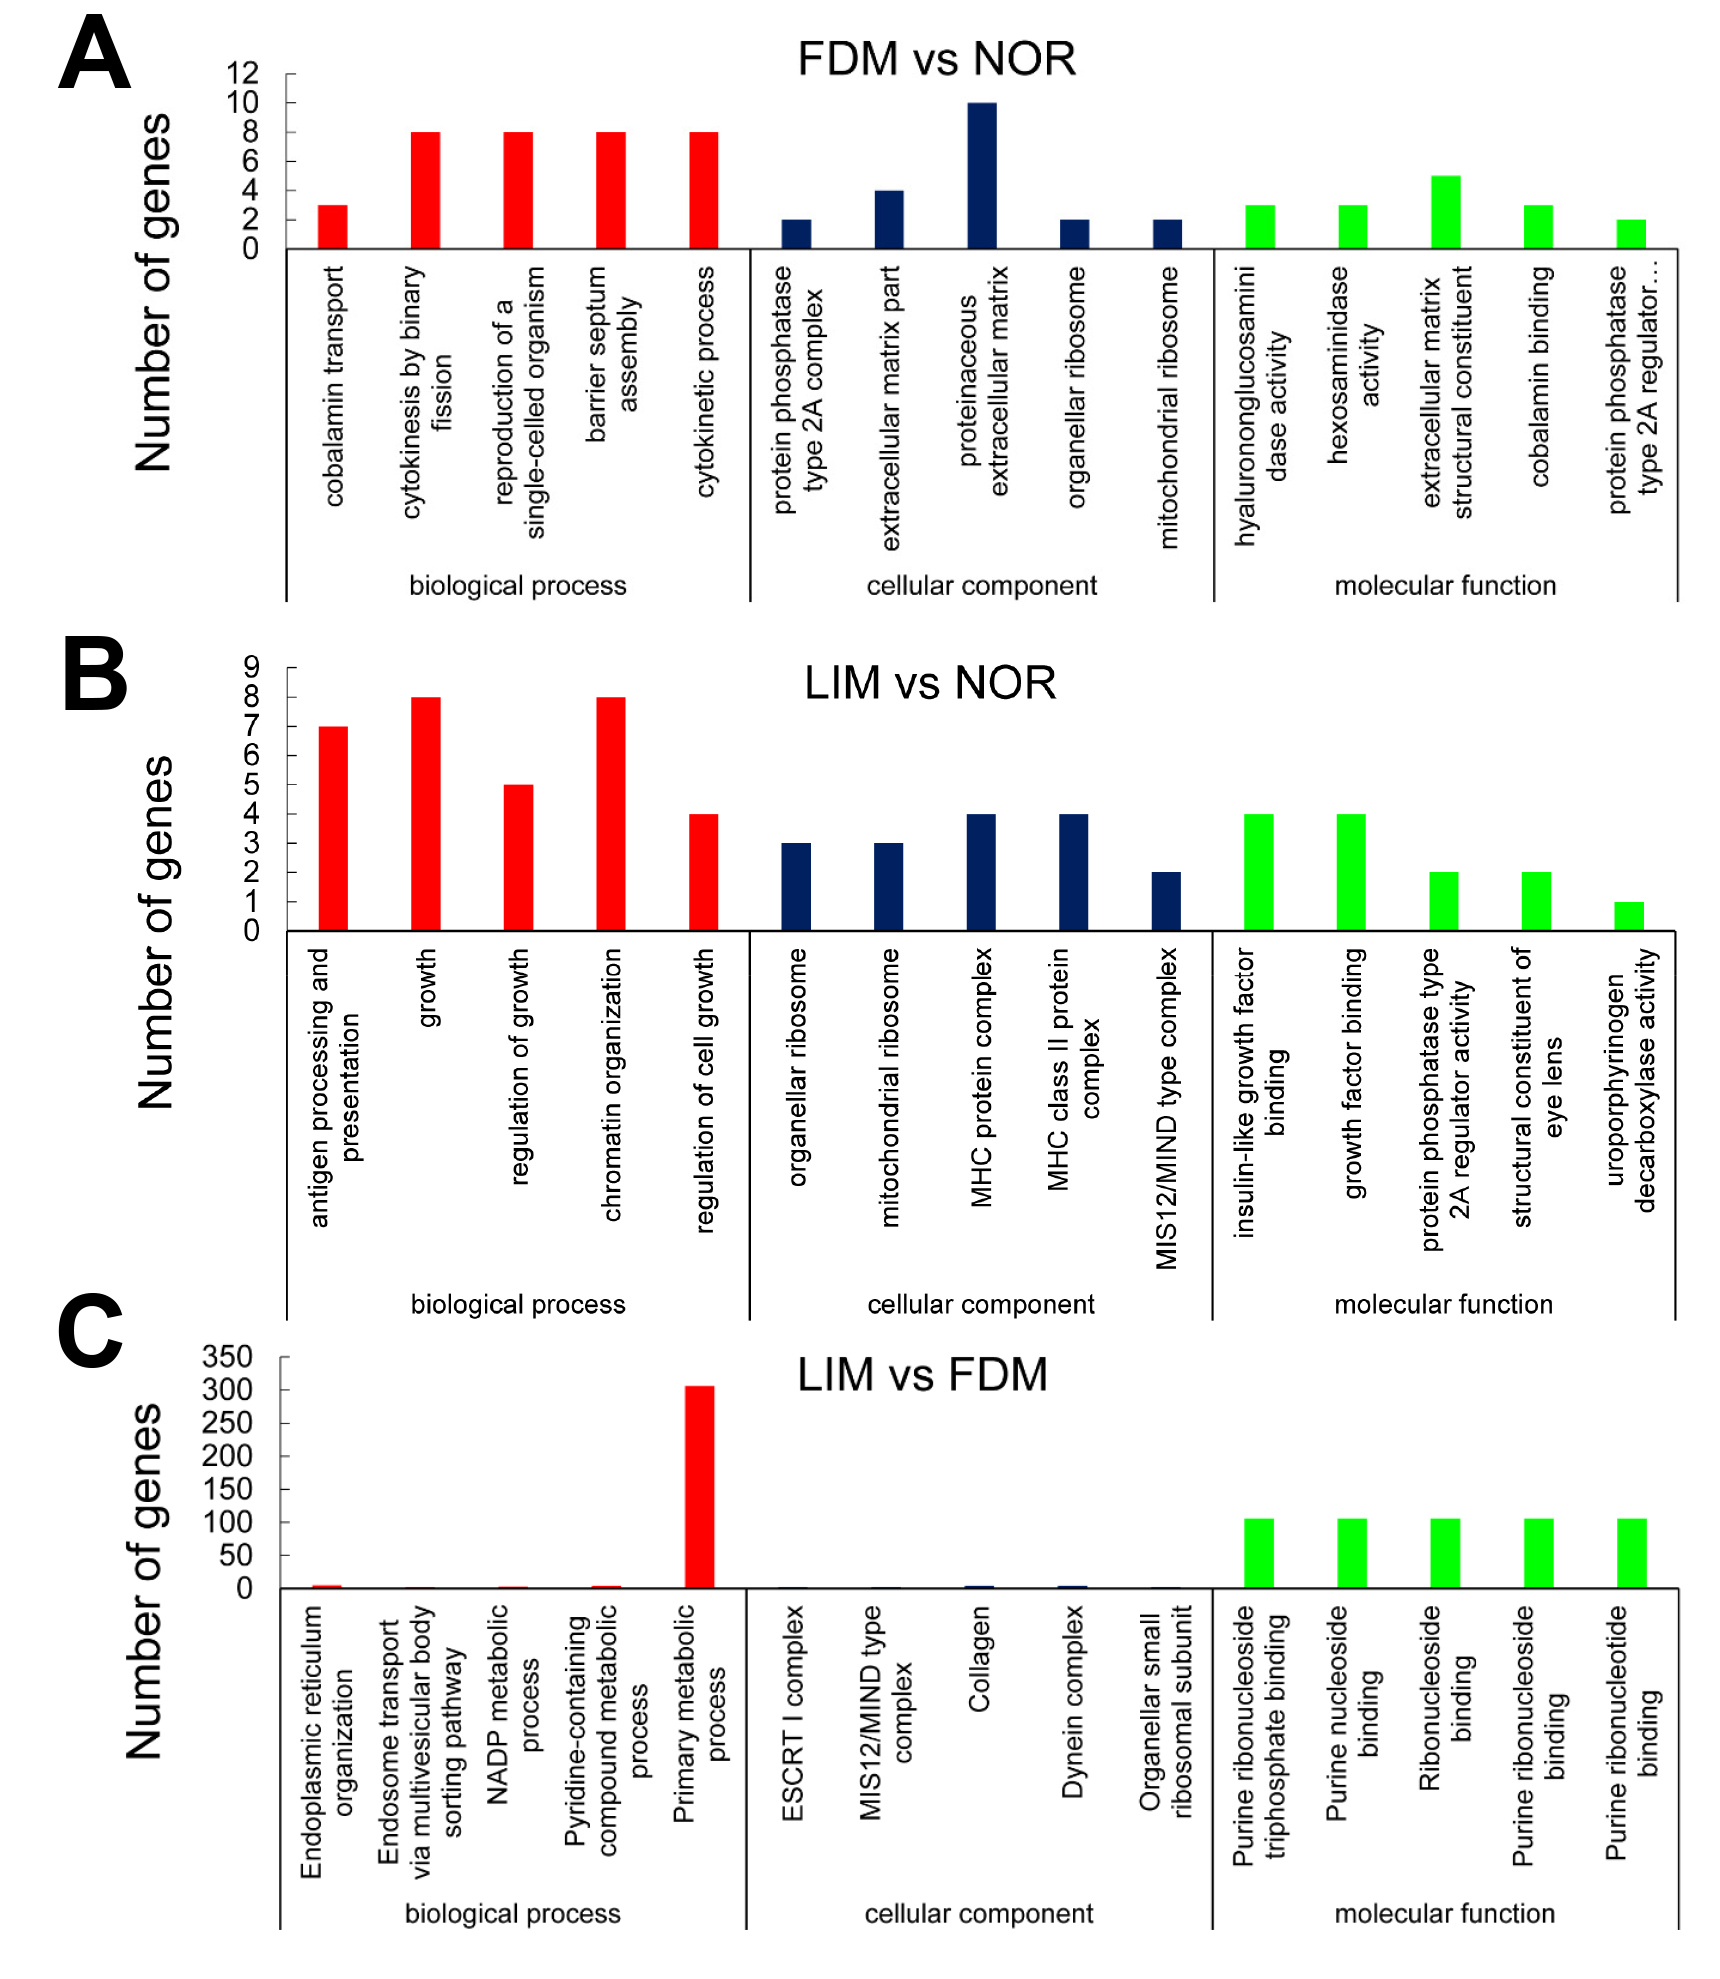
Figure 7.
GO analysis. GO enrichment histograms of the target genes of the differentially expressed lncRNAs between the FDM and normal control groups (
A
), the LIM and normal control groups (
B
), as well as the FDM and LIM groups (
C
) are shown.
 Figure 7 of
Geng, Mol Vis 2020; 26:117-134.
Figure 7 of
Geng, Mol Vis 2020; 26:117-134.