Figure 5. Volcanic maps of the differentially expressed lncRNAs. Volcanic maps of the differential expressed lncRNAs between the normal
control and FDM groups (A), the normal control and LIM groups (B), and the LIM and FDM groups (C) are shown. A Venn diagram of the differentially expressed lncRNAs (D), upregulated lncRNAs (E), and downregulated lncRNAs (F) in the three groups is also displayed. NOR: normal control; FDM: form-deprivation myopia; LIM: lens-induced myopia.
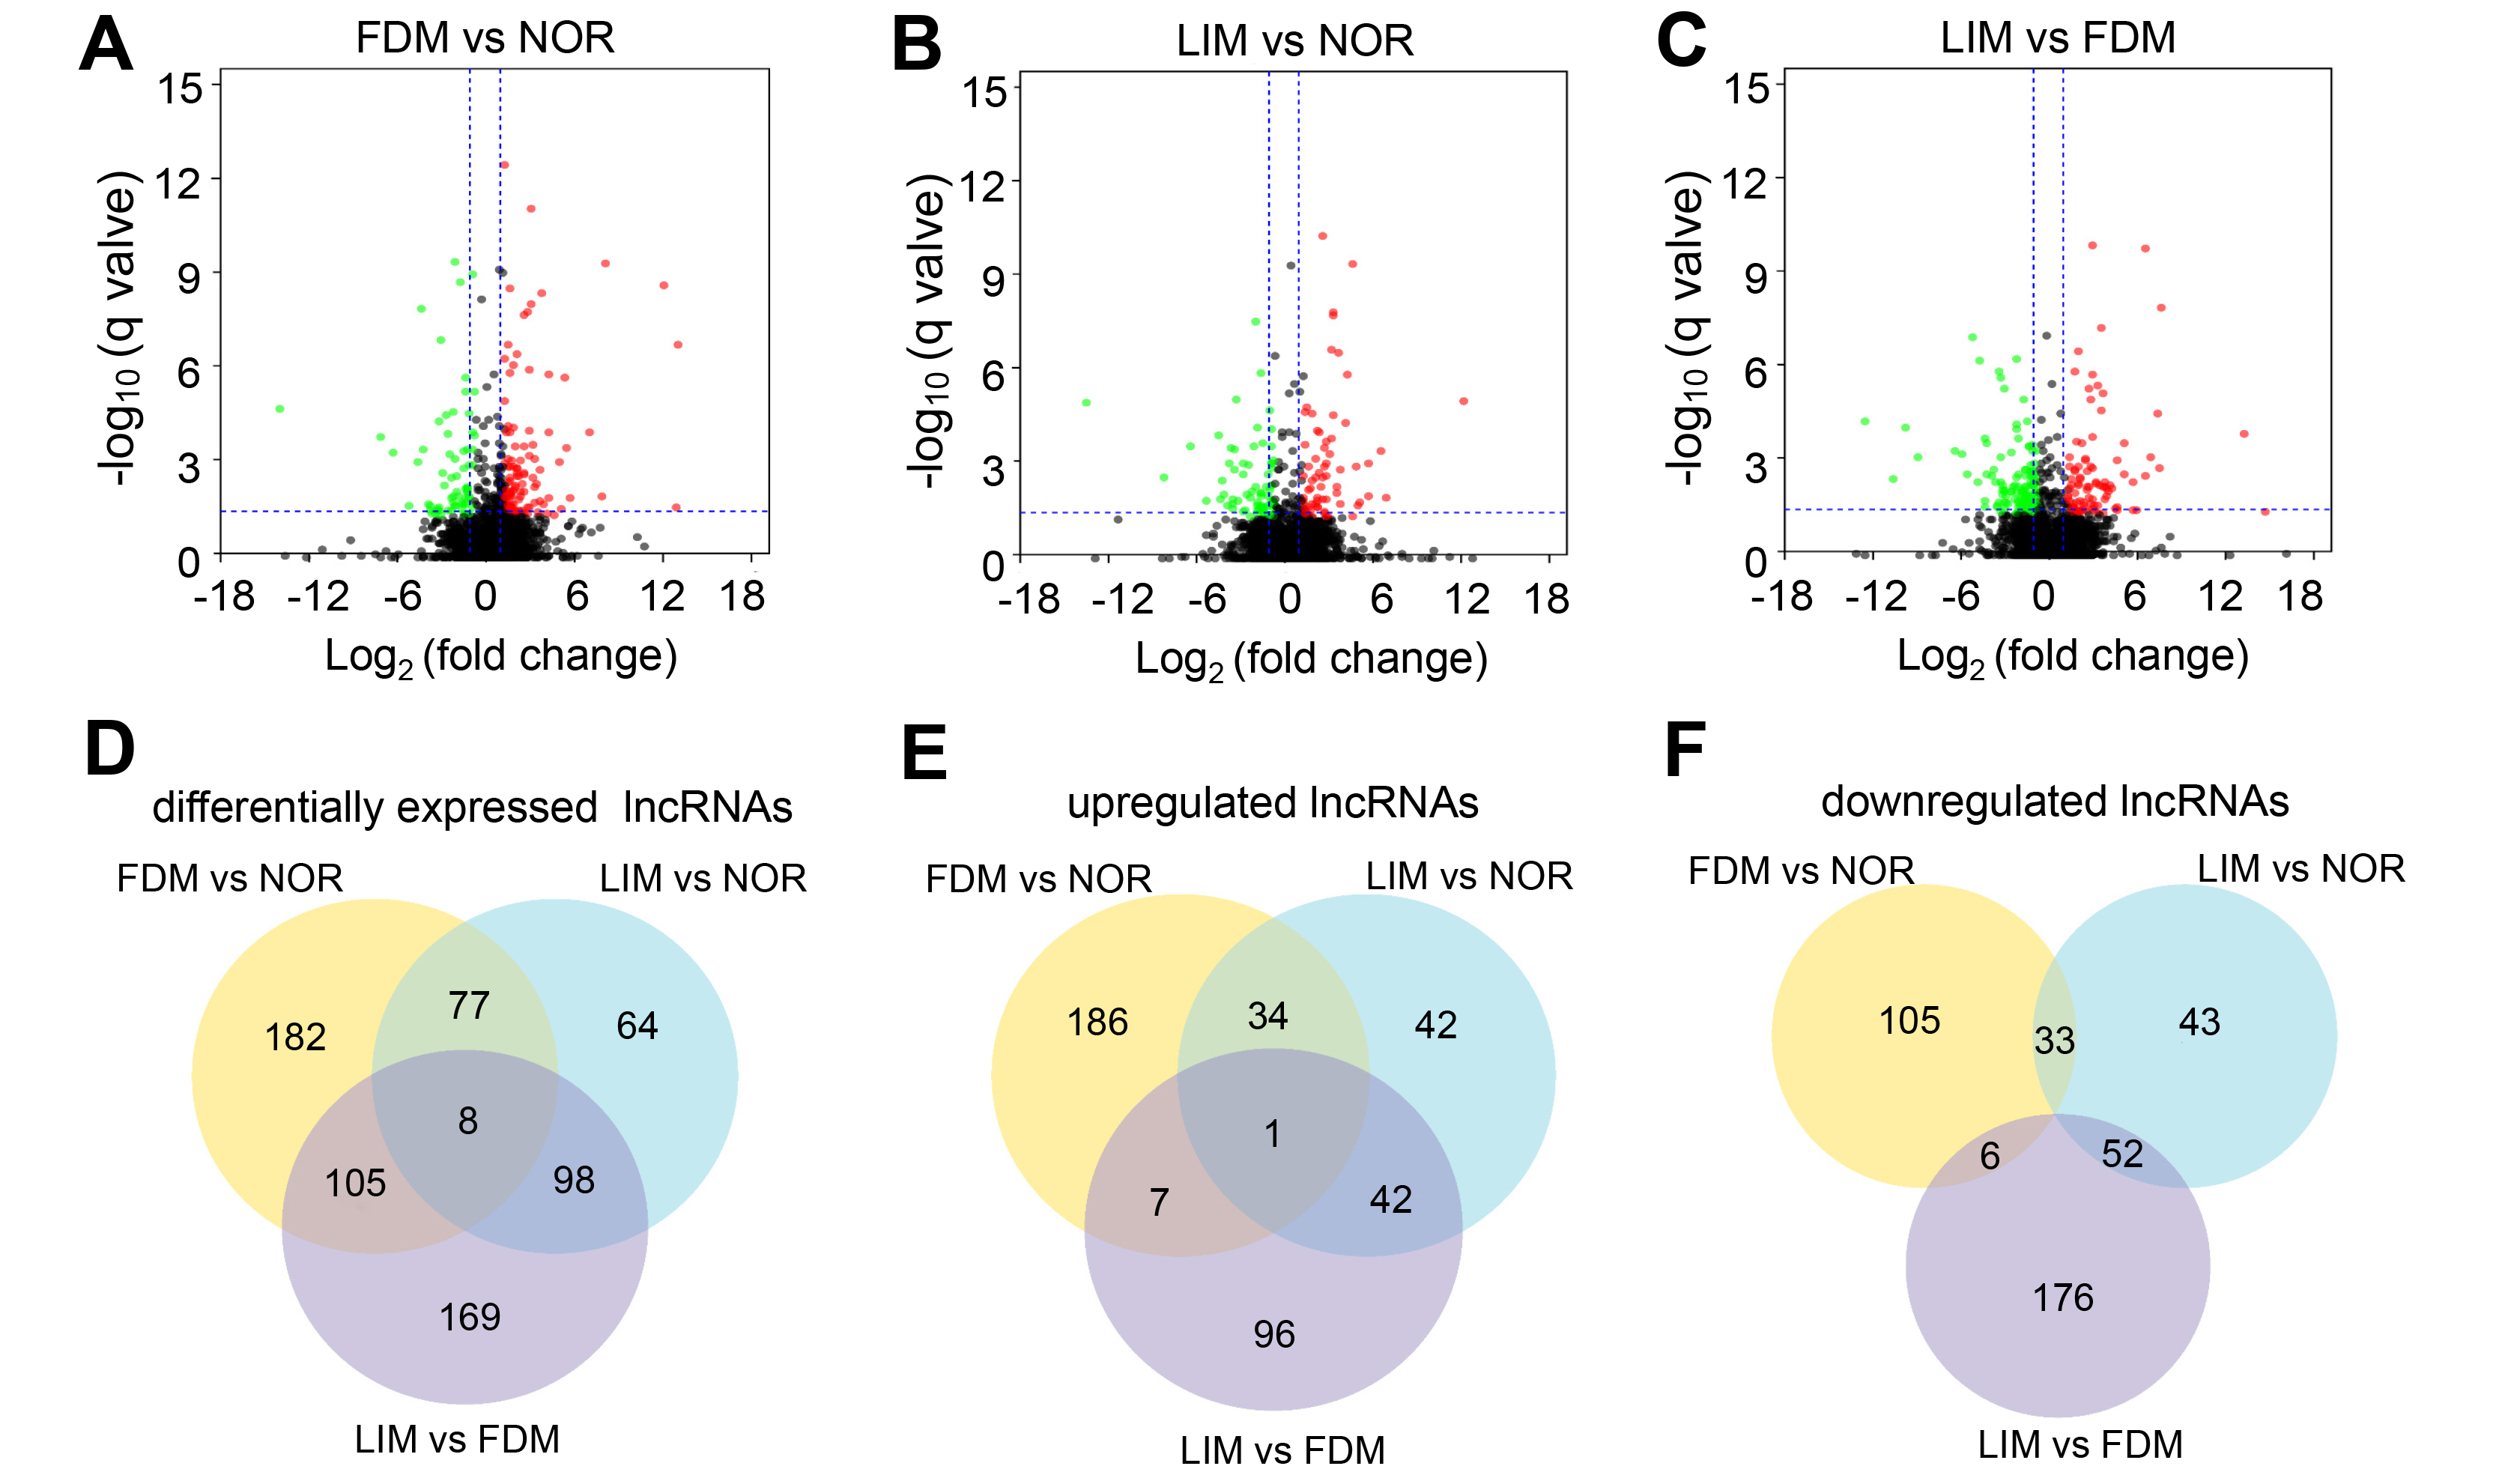
 Figure 5 of
Geng, Mol Vis 2020; 26:117-134.
Figure 5 of
Geng, Mol Vis 2020; 26:117-134.