Figure 4. Clustering analysis of lncRNA expression in the experimental groups. The overall fragments per kilobase million (FPKM) hierarchical
clustering map, clustered by log10 (FPKM+1) values, is shown. The color scale on the right illustrates the relative expression levels of the lncRNAs in the
experimental groups. Red denotes the relative expression level greater than 0 and blue less than 0. NOR: normal control; FDM:
form-deprivation myopia; LIM: lens-induced myopia; lincRNA: long intergenic non-coding RNA.
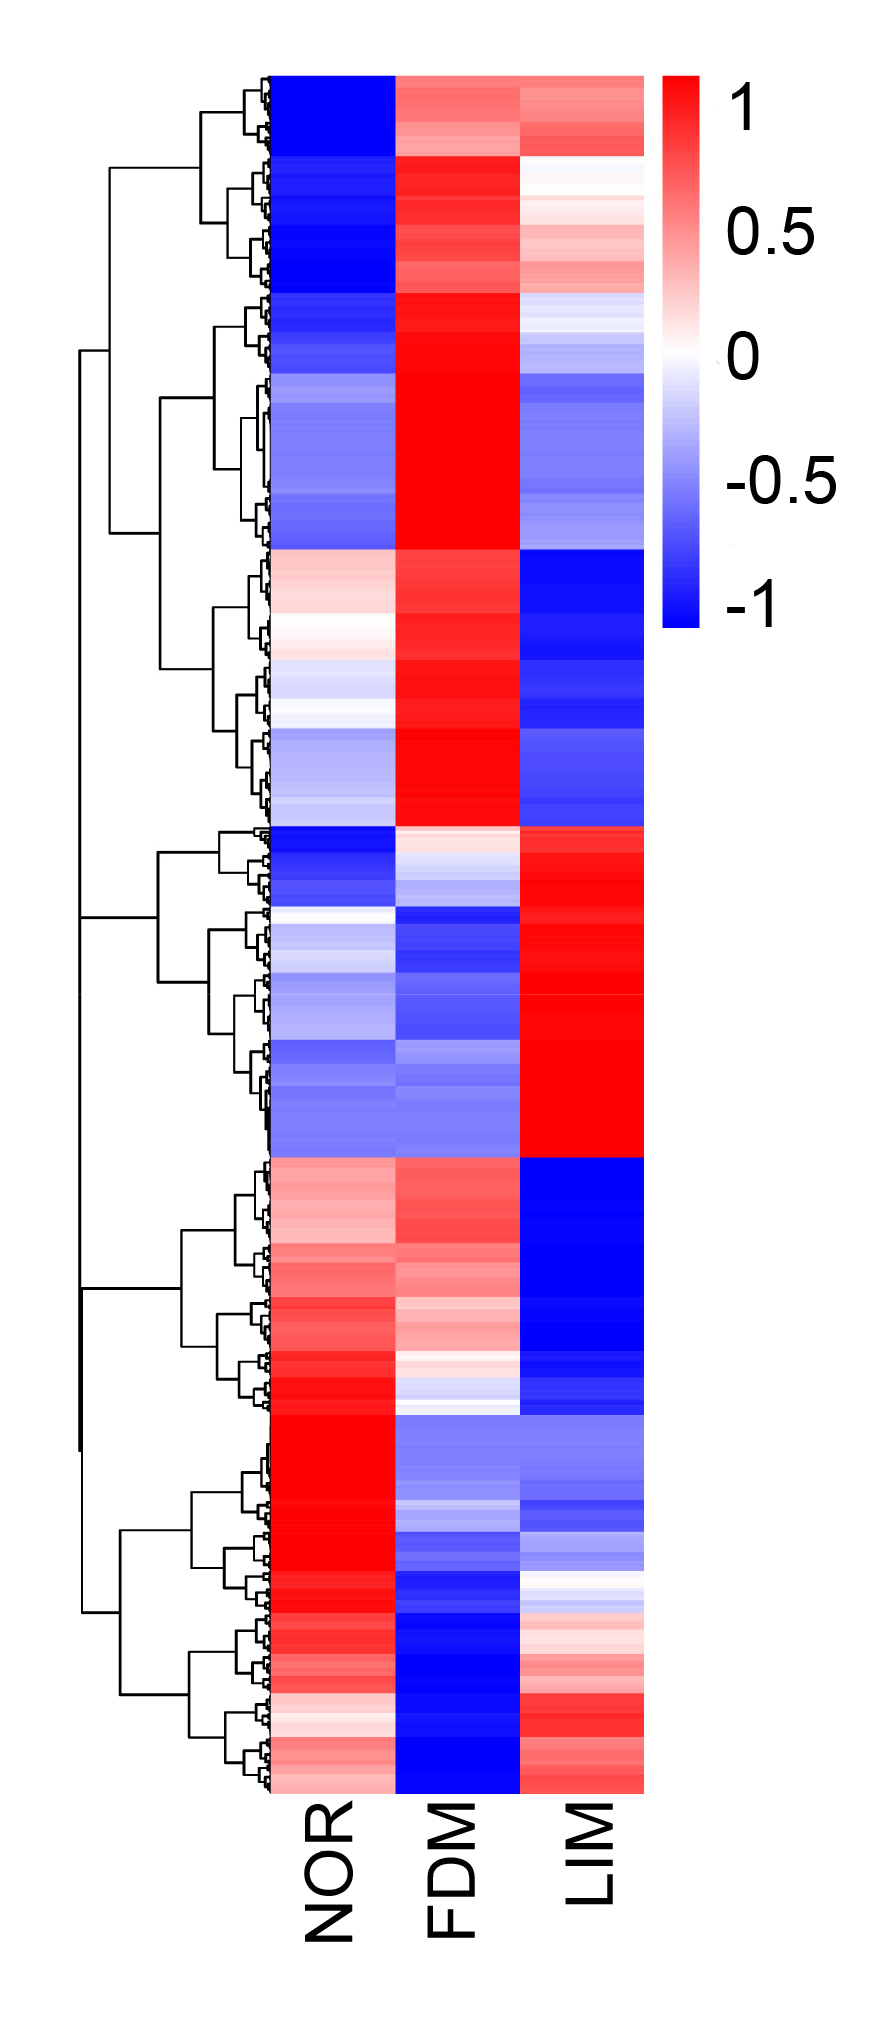
 Figure 4 of
Geng, Mol Vis 2020; 26:117-134.
Figure 4 of
Geng, Mol Vis 2020; 26:117-134.