Figure 3. SNPs and screening of lncRNAs. A: The line graph shows the top 30 chromosomes with the largest number of single nucleotide polymorphisms (SNPs) in the three
experimental groups. B: The violin plot shows the distribution of the SNPs on the top 30 chromosomes in the experimental groups. The horizontal
dotted lines from top to bottom represent the 75%, 50% and 25% quartiles, respectively. C: Screening histogram of lncRNAs. D: The distribution pie chart of lncRNA types. NOR: normal control; FDM: form-deprived myopia; LIM: lens-induced myopia.
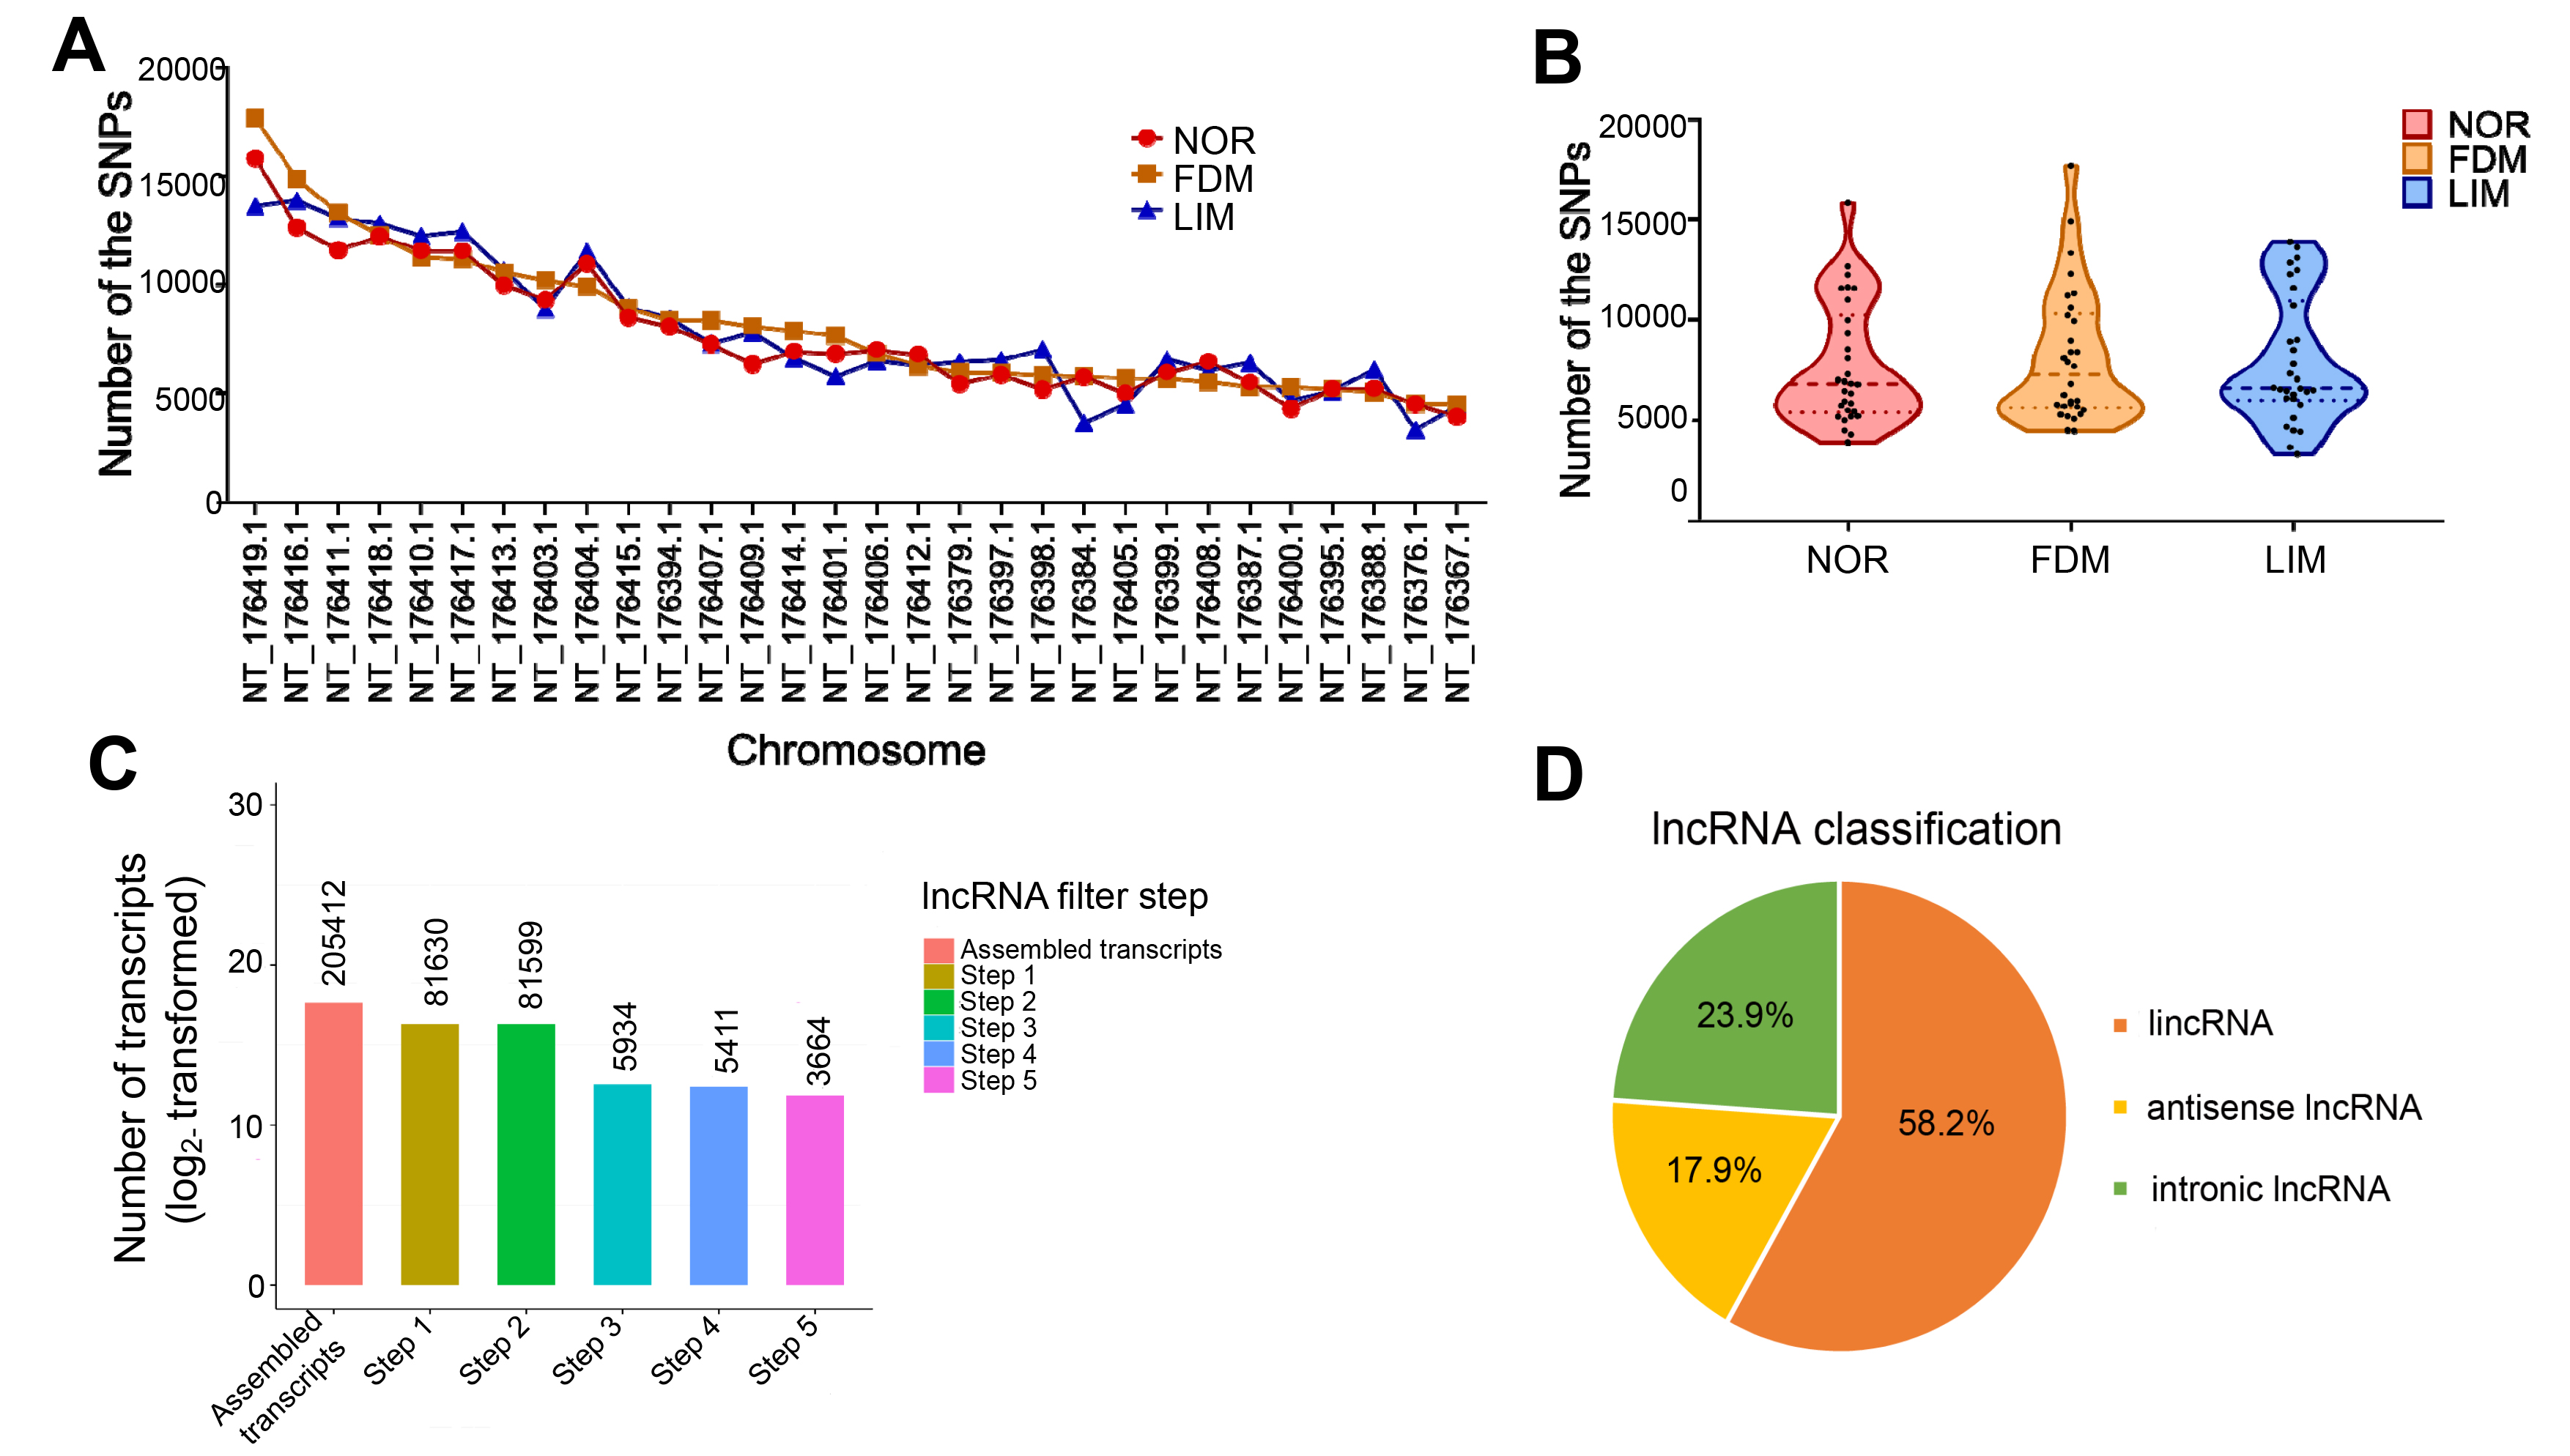
 Figure 3 of
Geng, Mol Vis 2020; 26:117-134.
Figure 3 of
Geng, Mol Vis 2020; 26:117-134.