Figure 2. H&E staining of the ocular posterior pole. The representative pictures of hematoxylin and eosin (H&E) staining of the right
eye posterior pole in the normal control (A), FDM (B), and LIM (C) groups as well as the untreated left eyes in the FDM (E) and LIM (F) groups are shown. Scale bar = 50 µm. The thicknesses of the sclera and the choroid at three different positions (left third,
middle third, right third) of each picture were measured and labeled as white line segments and numbers. The average of the
three measurements was recorded and is compared in (D) and (G) using one-way ANOVA and paired t test, respectively. *** p<0.001. NOR: normal control; FDM-R: right eyes in form-deprivation
myopia group; LIM-R: right eyes in lens-induced myopia group; FDM-L: left eyes in form-deprivation myopia group; LIM-L: left
eyes in lens-induced myopia group.
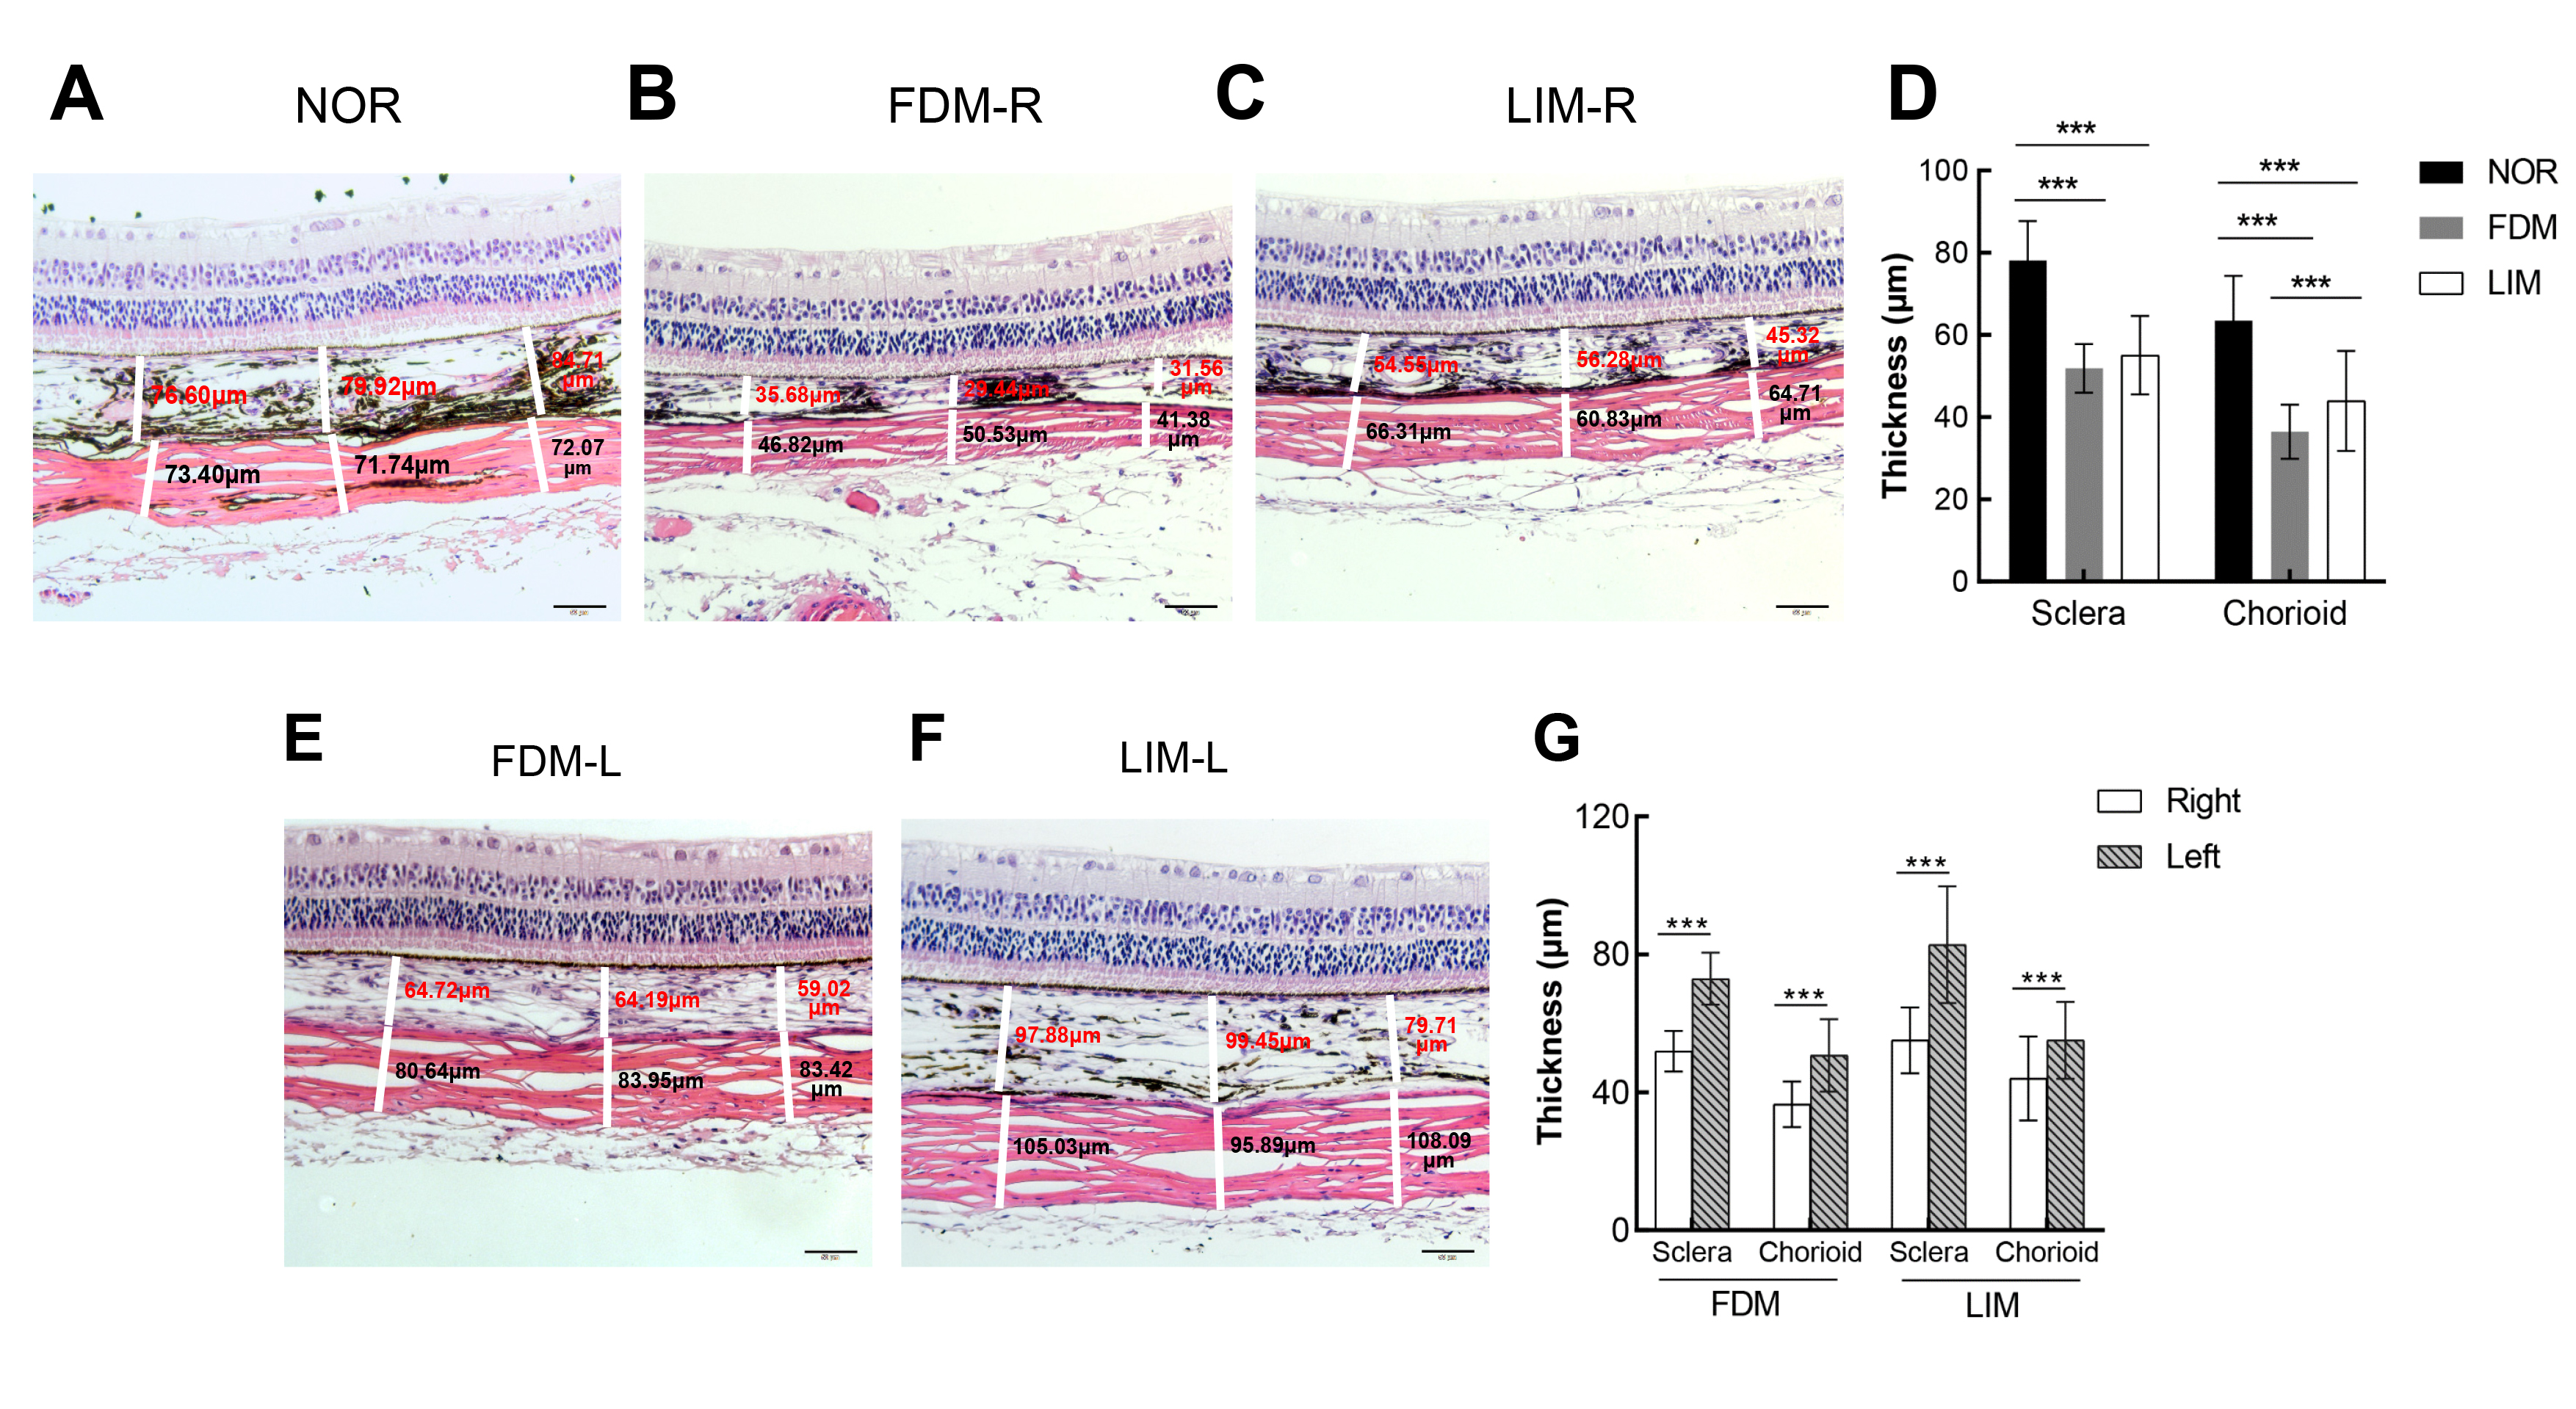
 Figure 2 of
Geng, Mol Vis 2020; 26:117-134.
Figure 2 of
Geng, Mol Vis 2020; 26:117-134.