Figure 4. Effect of medium refresh on the phase and endogenous period of PER2::Luc oscillations after 4, 6, 8, 9, and 10 days in culture. A: Representatives curves of PER2::Luc oscillations after changing the medium of the retinal explants after 4 (black line)
or 9 days (red line) in culture. Red and black arrows correspond to troughs and peaks of the first complete PER2::Luc oscillation
for each condition. B: Phase of the first troughs (black circles) and first peaks (white circles) after changing the medium of the retinal explants
after 4, 6, 8, 9, or 10 days in culture. Day 0 corresponds to the first complete oscillation after the beginning of the culture.
C: Variation in the endogenous period of PER2::Luc oscillations before and after the medium change. Data are represented as
mean±SD (day 0: n = 8; 4–10 days: n = 6–8).
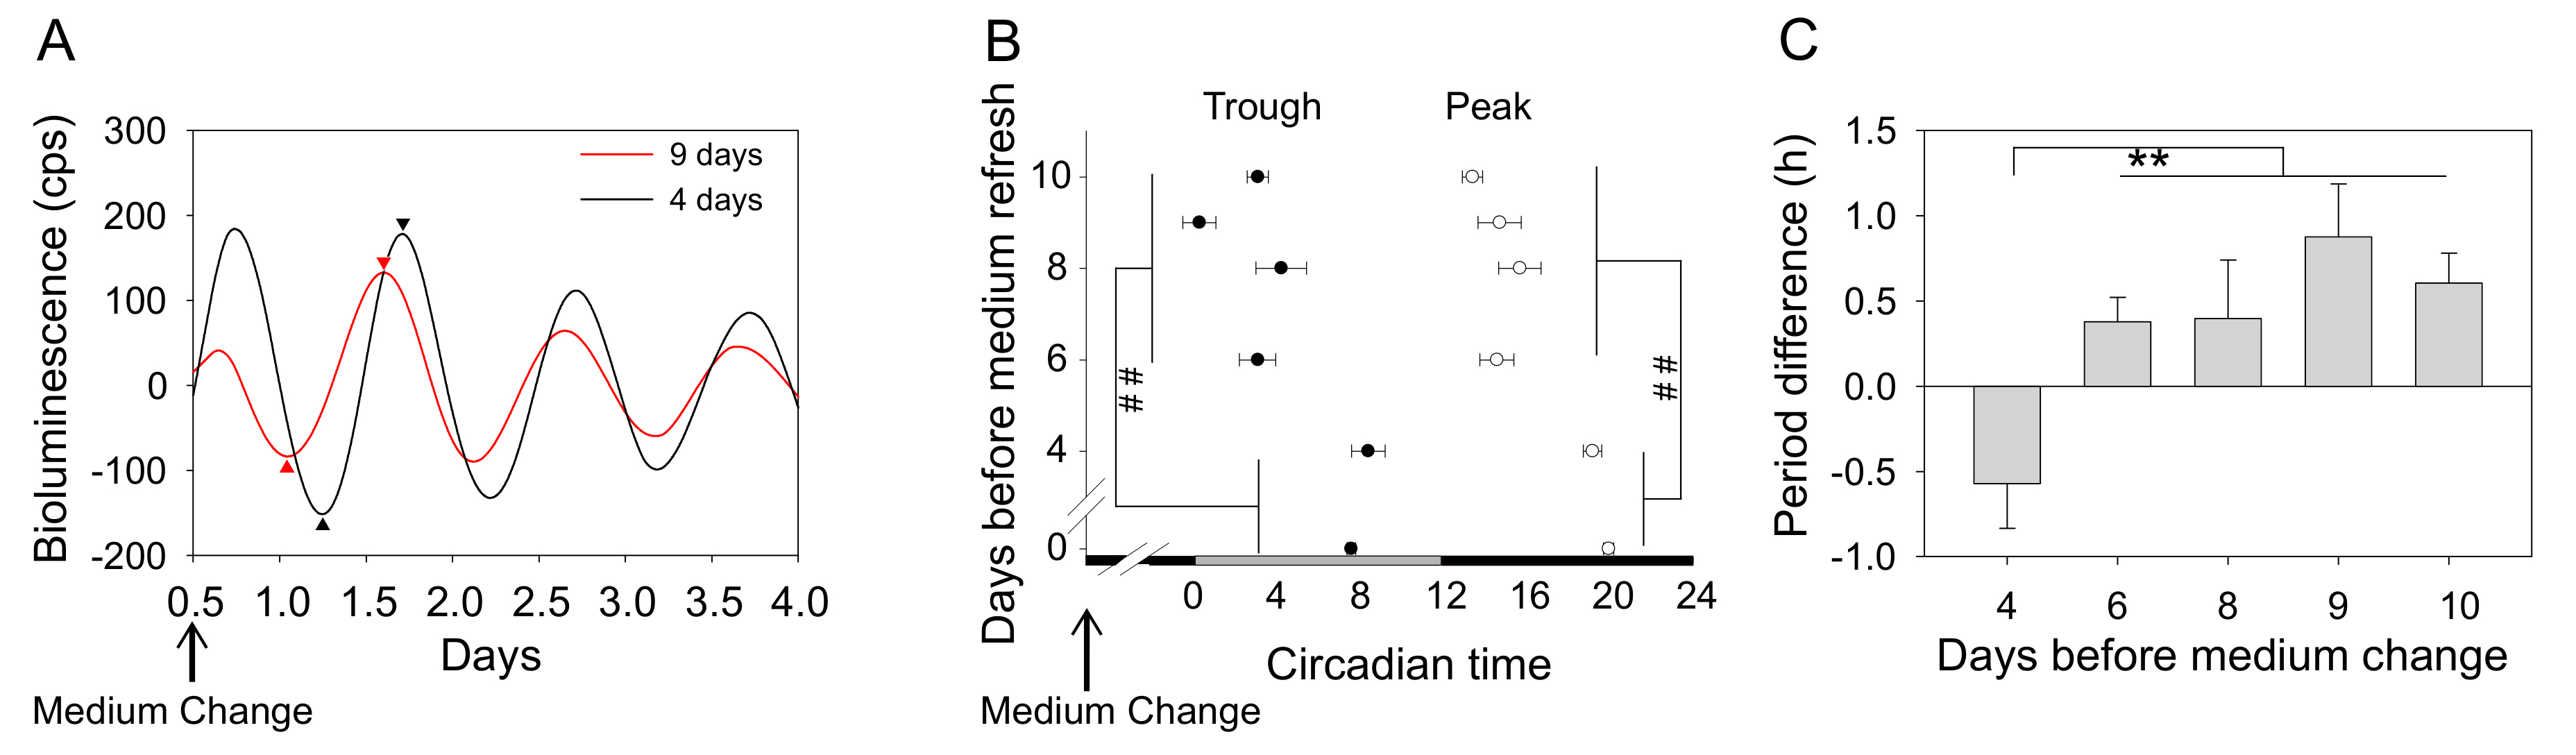
 Figure 4 of
Calligaro, Mol Vis 2020; 26:106-116.
Figure 4 of
Calligaro, Mol Vis 2020; 26:106-116.