Figure 6. The expression levels of the RNAs correlated with keratoconus (KC). A: The expression levels of the mRNAs correlated with KC. B: The expression levels of the microRNAs (miRNAs) correlated with KC. C: The expression levels of the long non-coding RNAs (lncRNAs) correlated with KC. Black and white columns represent KC samples
and control samples, respectively.
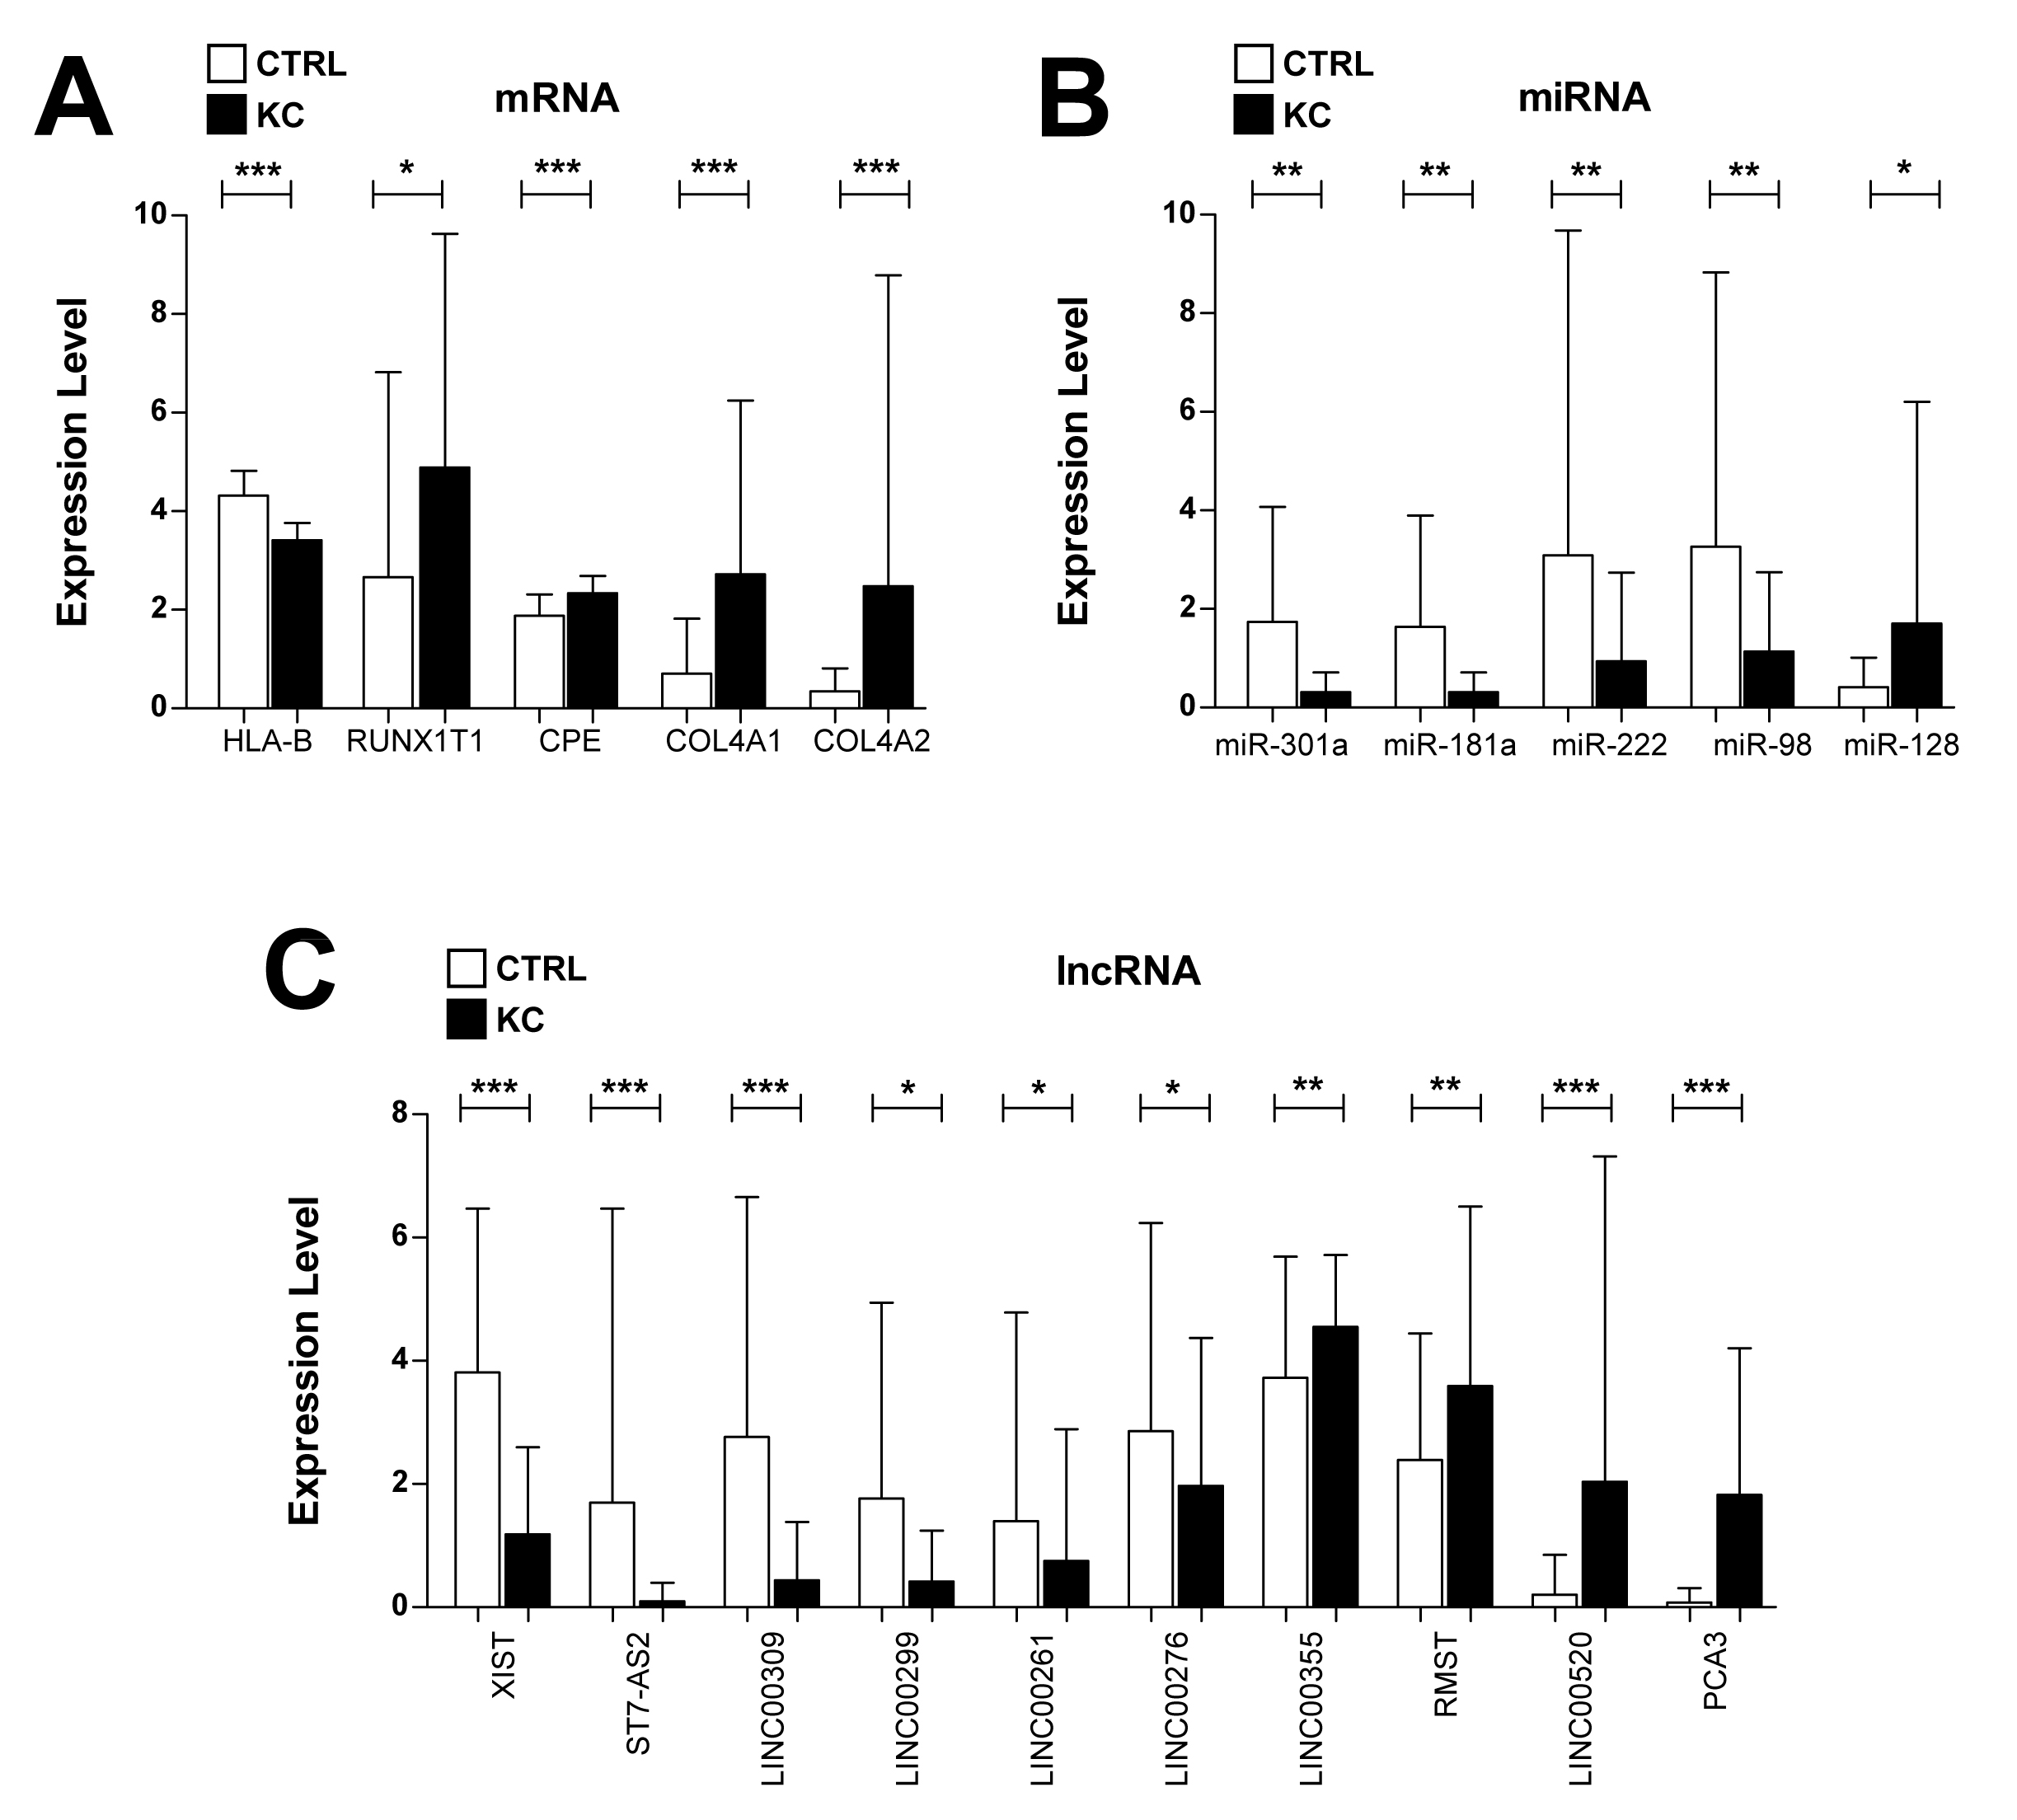
 Figure 6 of
Tian, Mol Vis 2020; 26:1-13.
Figure 6 of
Tian, Mol Vis 2020; 26:1-13.