Figure 4. The competing endogenous RNA (ceRNA) regulatory network. The squares, diamonds, and circles represent long non-coding RNAs
(lncRNAs), microRNAs (miRNAs), and mRNAs, respectively. Blue and red represent upregulation and downregulation, respectively.
Black lines and red lines represent, respectively, lncRNA–miRNA and miRNA–mRNA relationships.
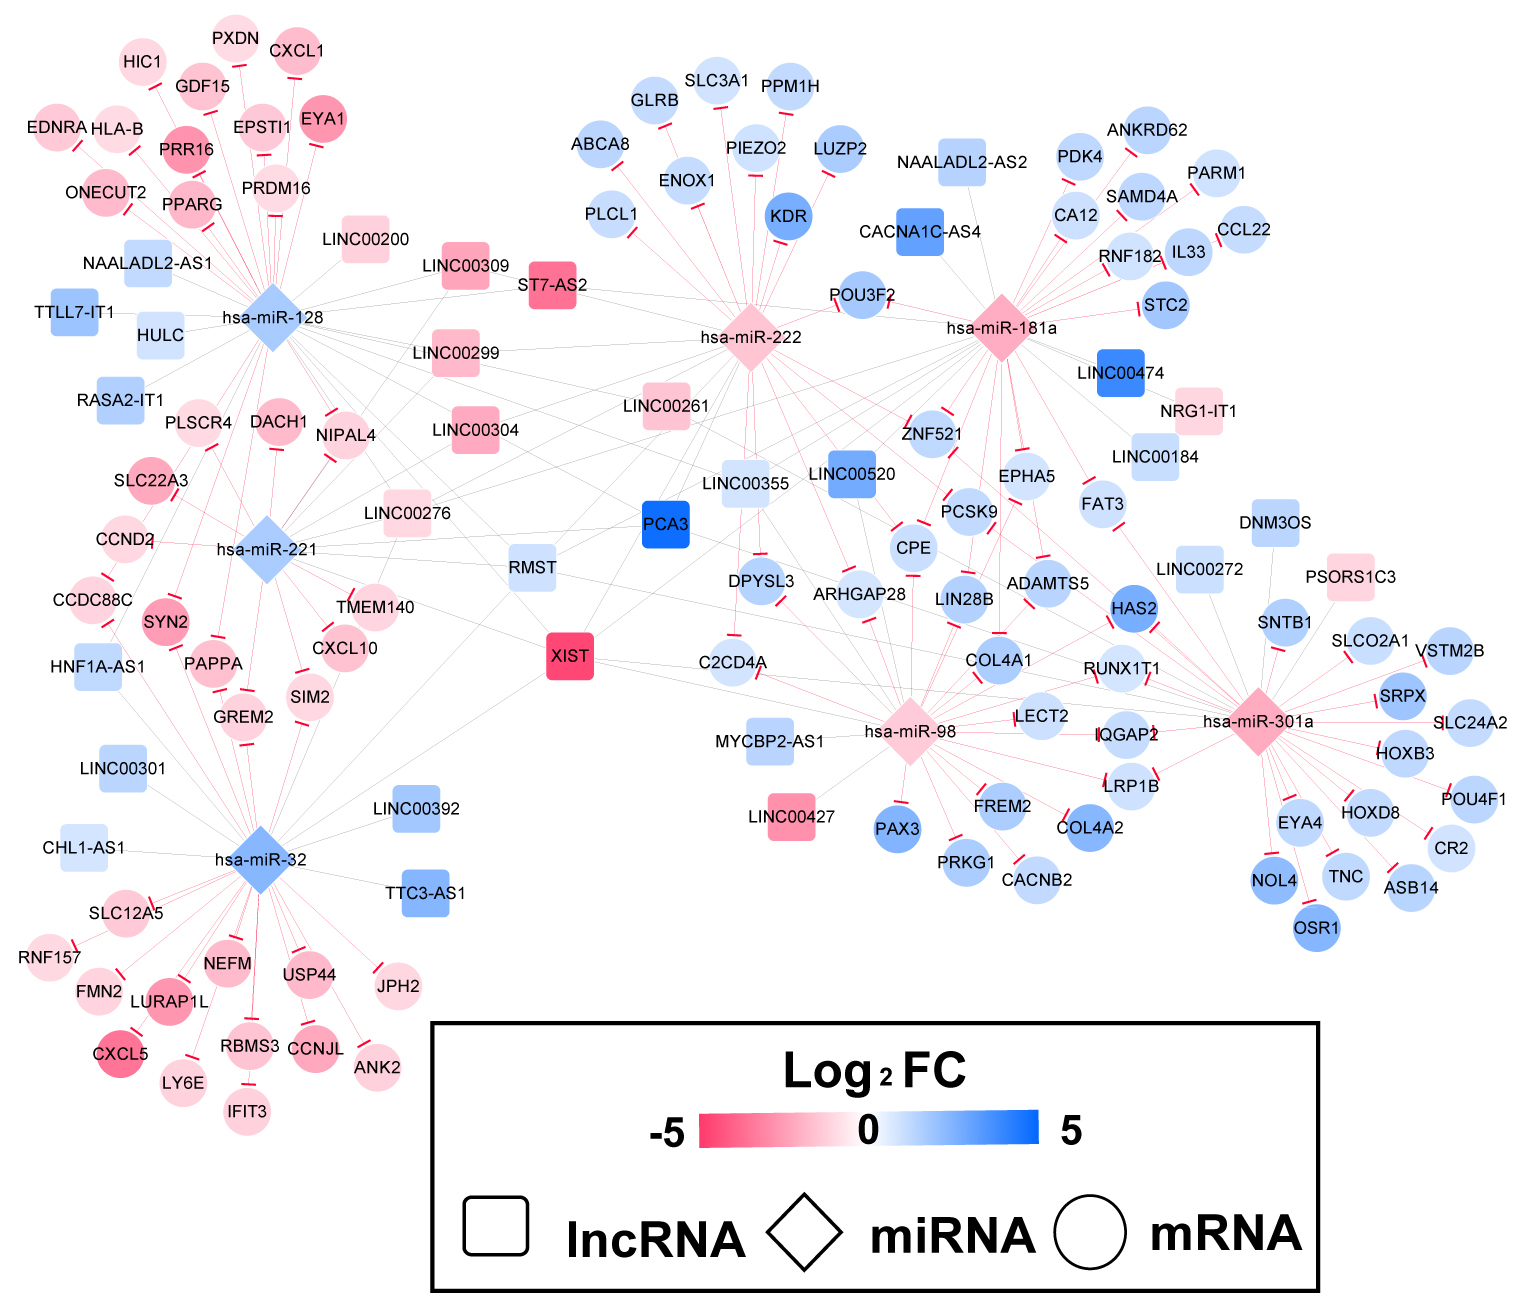
 Figure 4 of
Tian, Mol Vis 2020; 26:1-13.
Figure 4 of
Tian, Mol Vis 2020; 26:1-13.