Figure 3 of
Tian, Mol Vis 2020; 26:1-13.
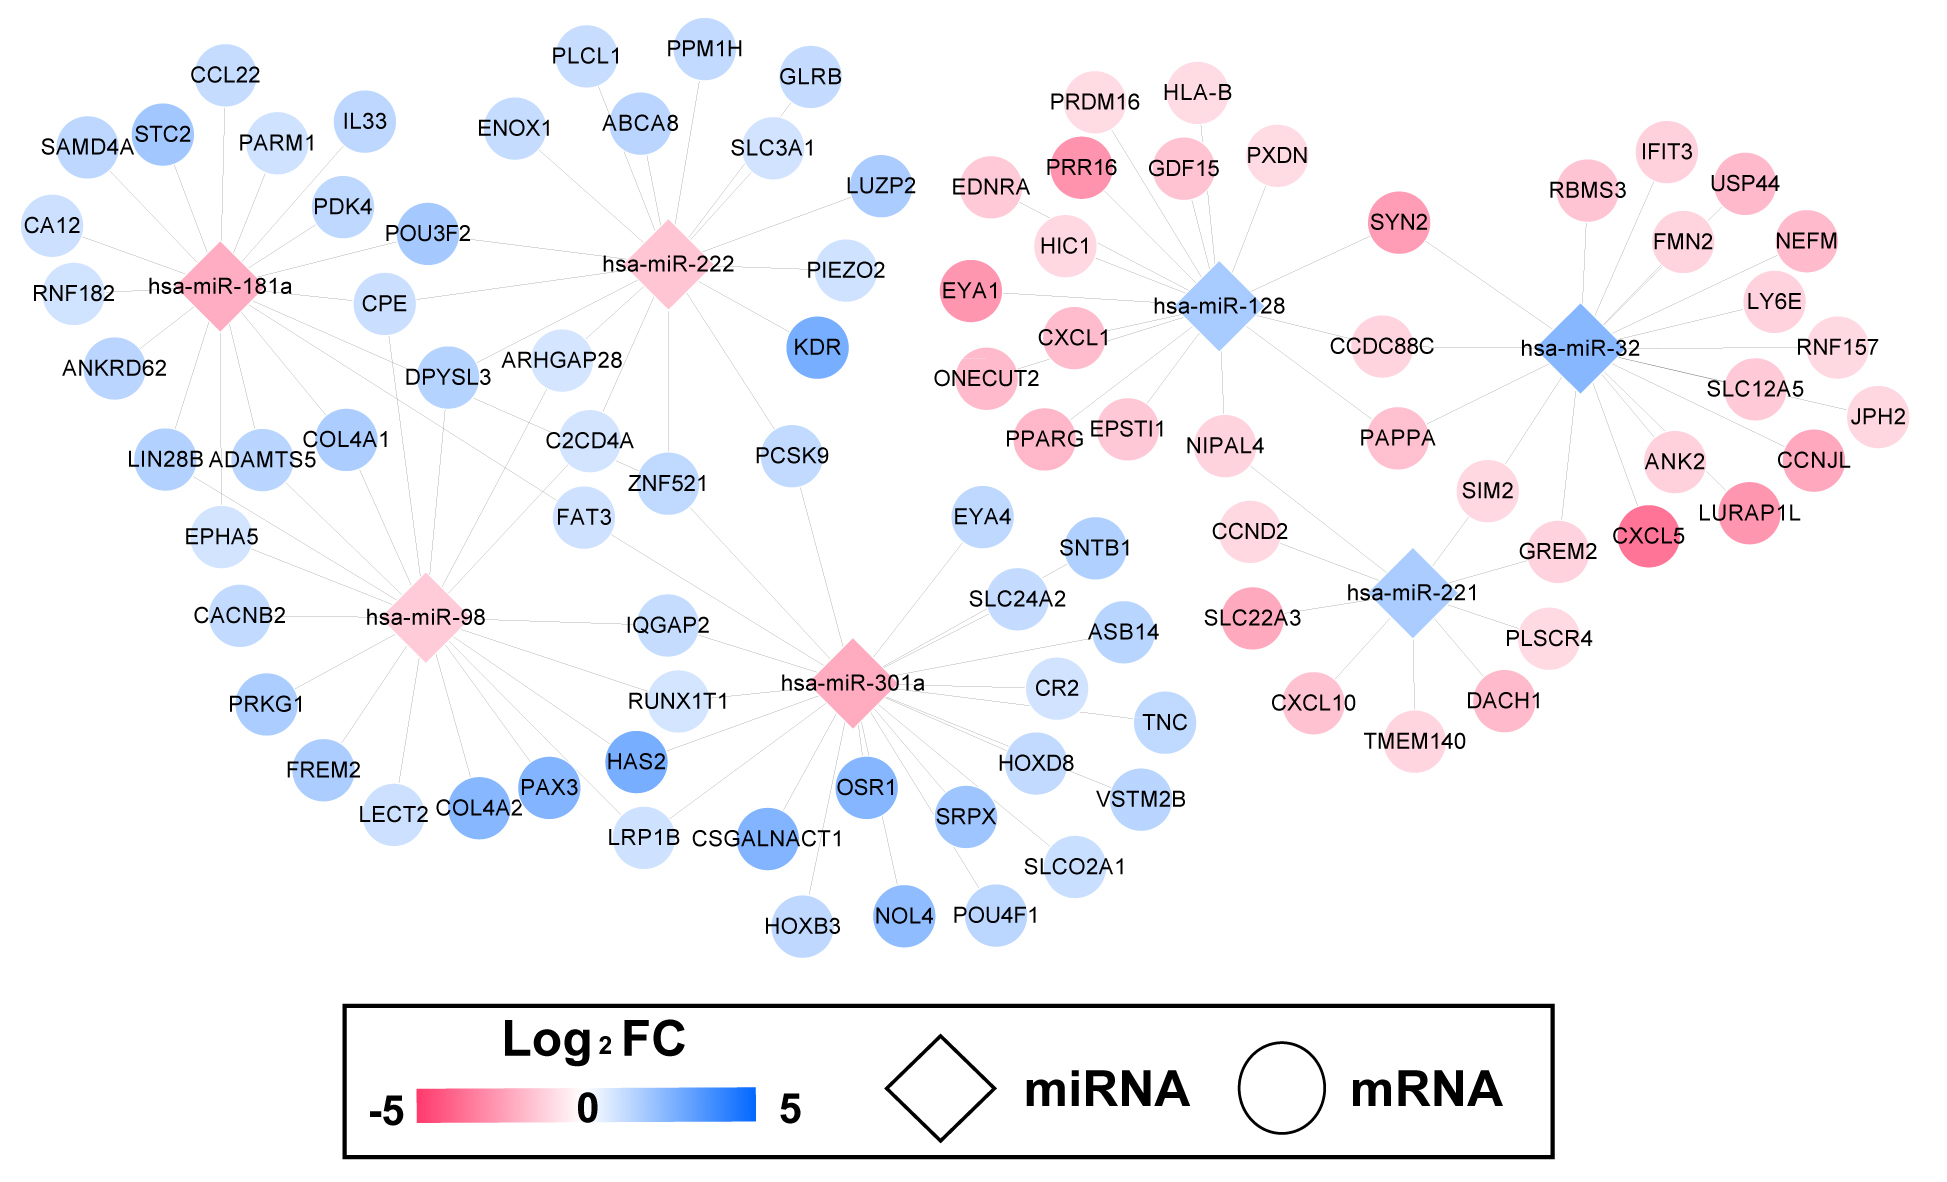
Figure 3.
The microRNA (miRNA)–mRNA regulatory network. The diamonds and circles represent miRNAs and mRNAs, respectively. Blue and red represent upregulation and downregulation, respectively.
 Figure 3 of
Tian, Mol Vis 2020; 26:1-13.
Figure 3 of
Tian, Mol Vis 2020; 26:1-13.