Figure 1. The expression distribution curves, scatter diagram, clustering heatmap, and histogram of the differentially expressed RNAs
(DE-RNAs). A: The expression distribution curves of the identified RNAs. The red, green, and blue curves represent long non-coding RNAs
(lncRNAs), microRNAs (miRNAs), and mRNAs, respectively. B: The scatter diagram of the DE-RNAs. The red, green, and blue dots represent significantly upregulated RNAs, significantly
downregulated RNAs, and non–DE-RNAs, respectively. C: The clustering heatmap of the DE-RNAs. B: The histogram showing the proportion of upregulated and downregulated RNAs.
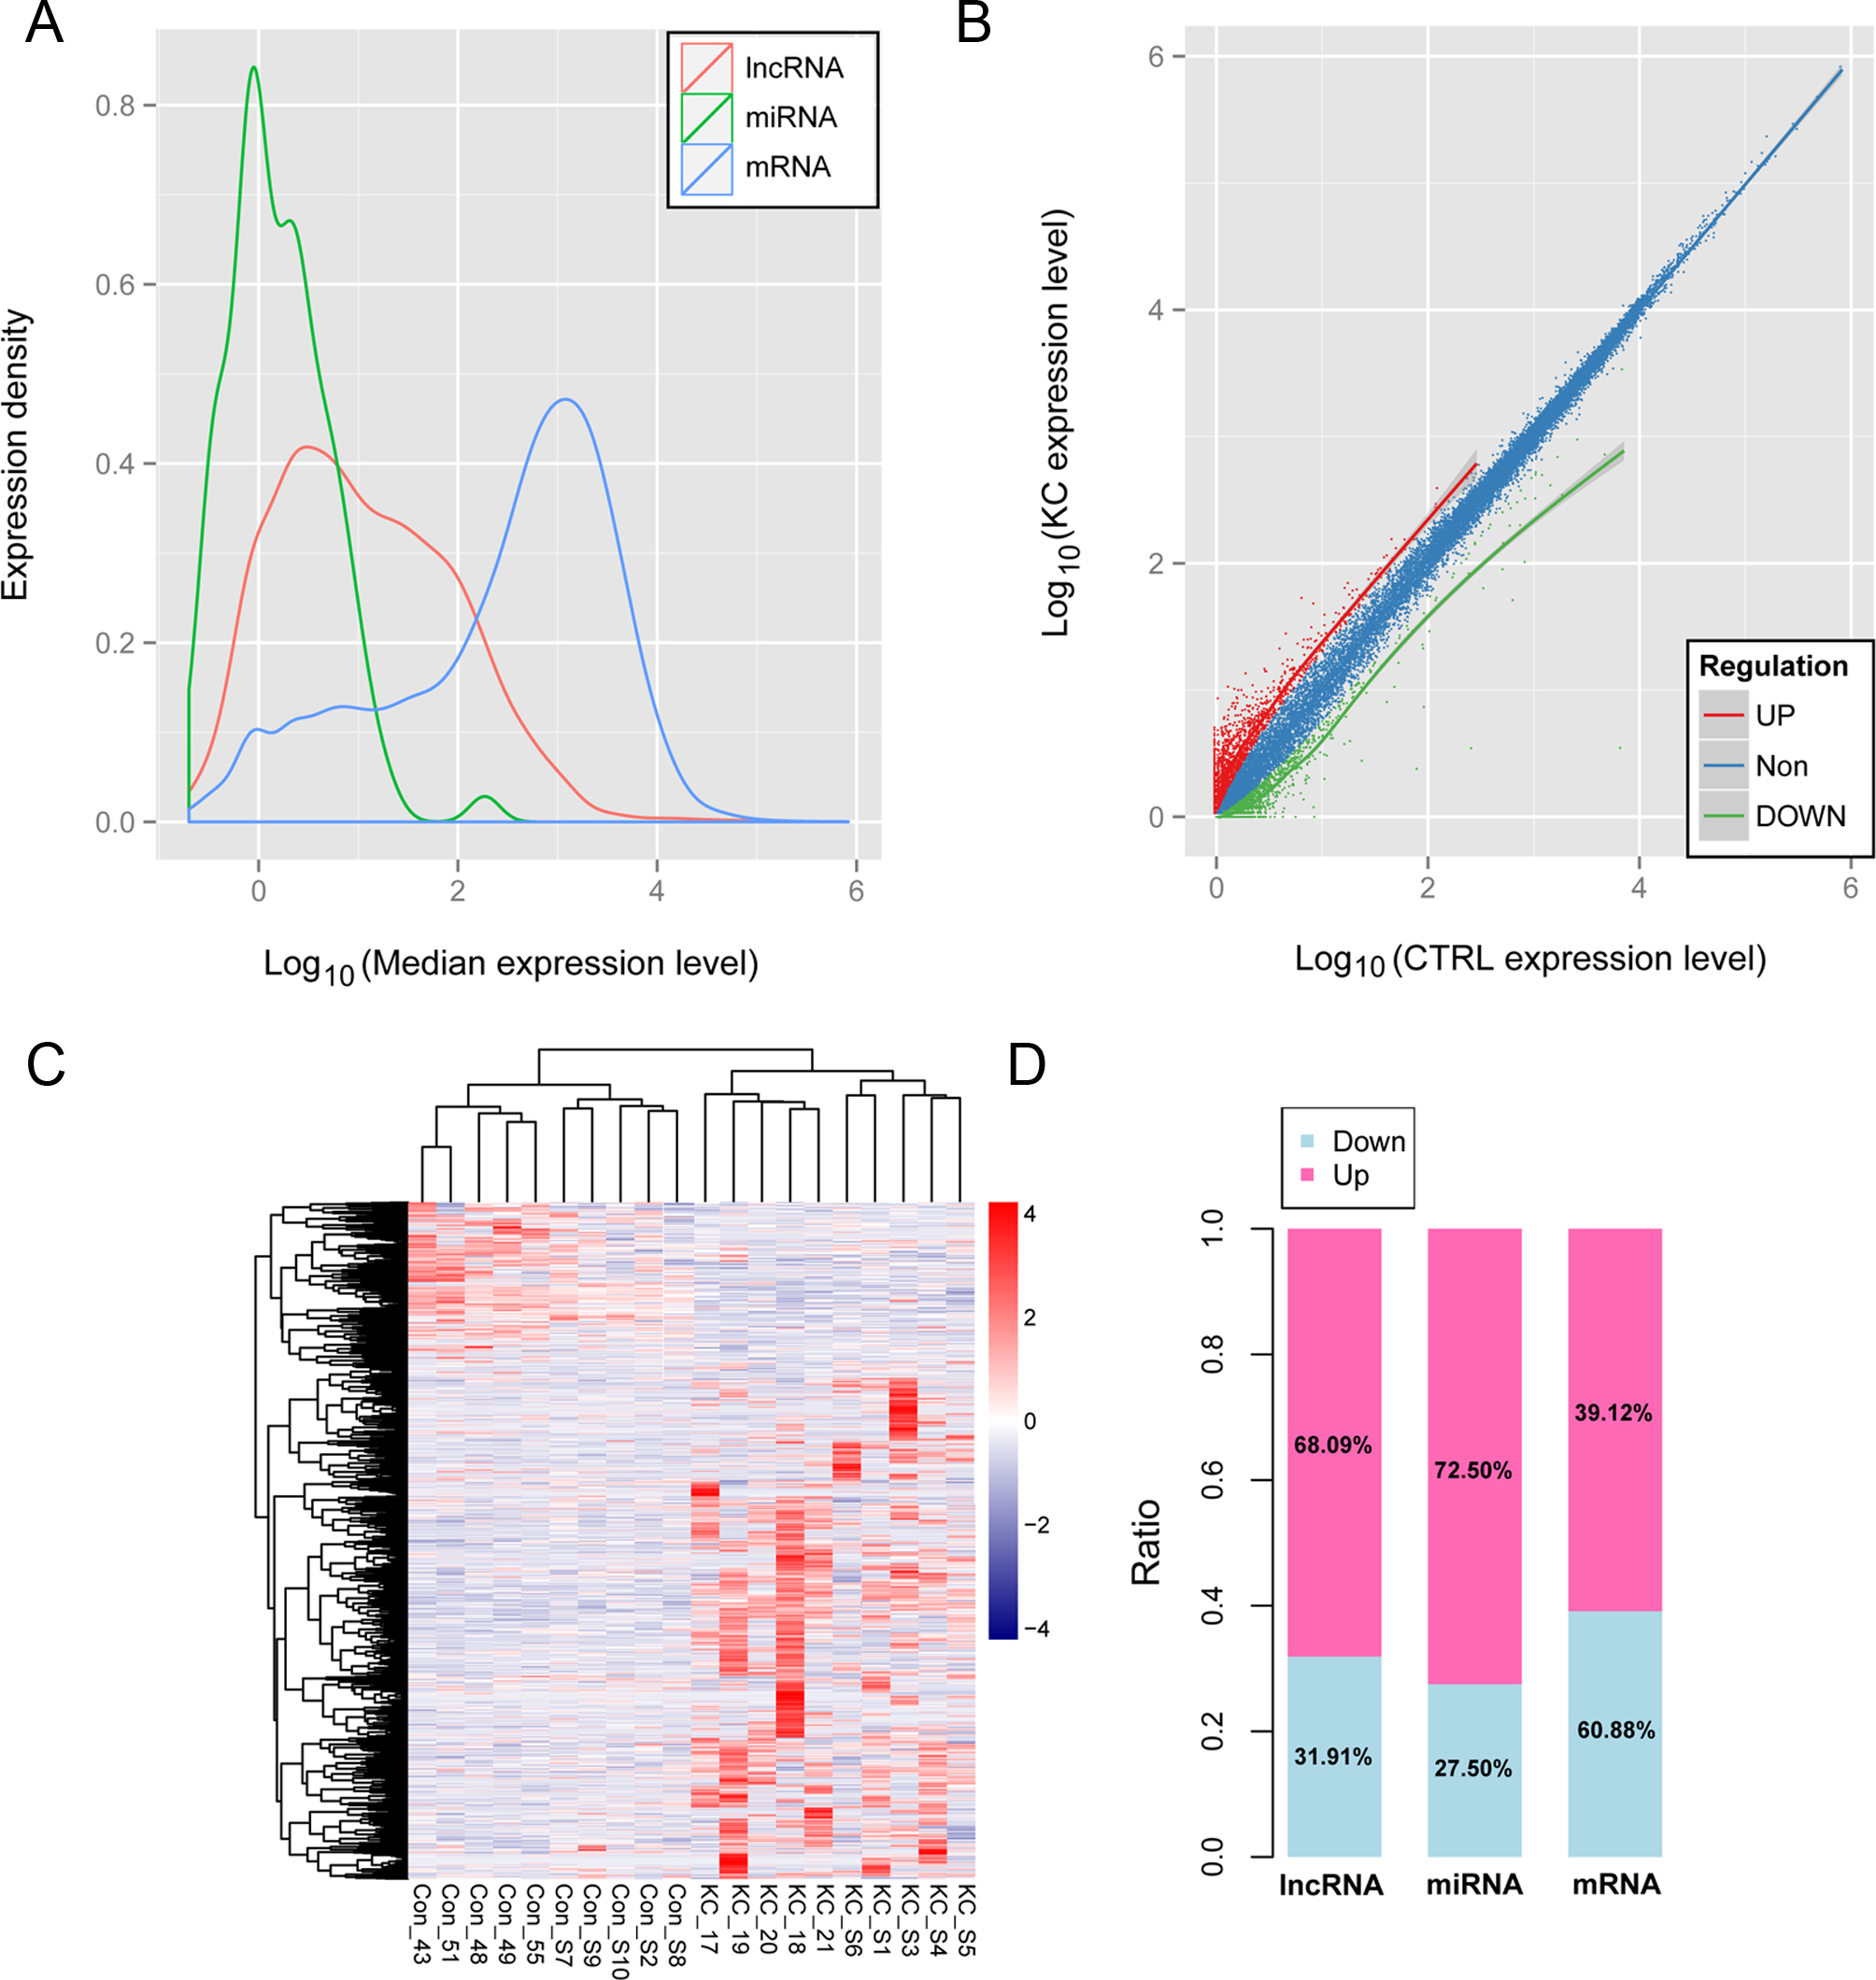
 Figure 1 of
Tian, Mol Vis 2020; 26:1-13.
Figure 1 of
Tian, Mol Vis 2020; 26:1-13.