Figure 1 of
Oliver, Mol Vis 2019; 25:93-105.
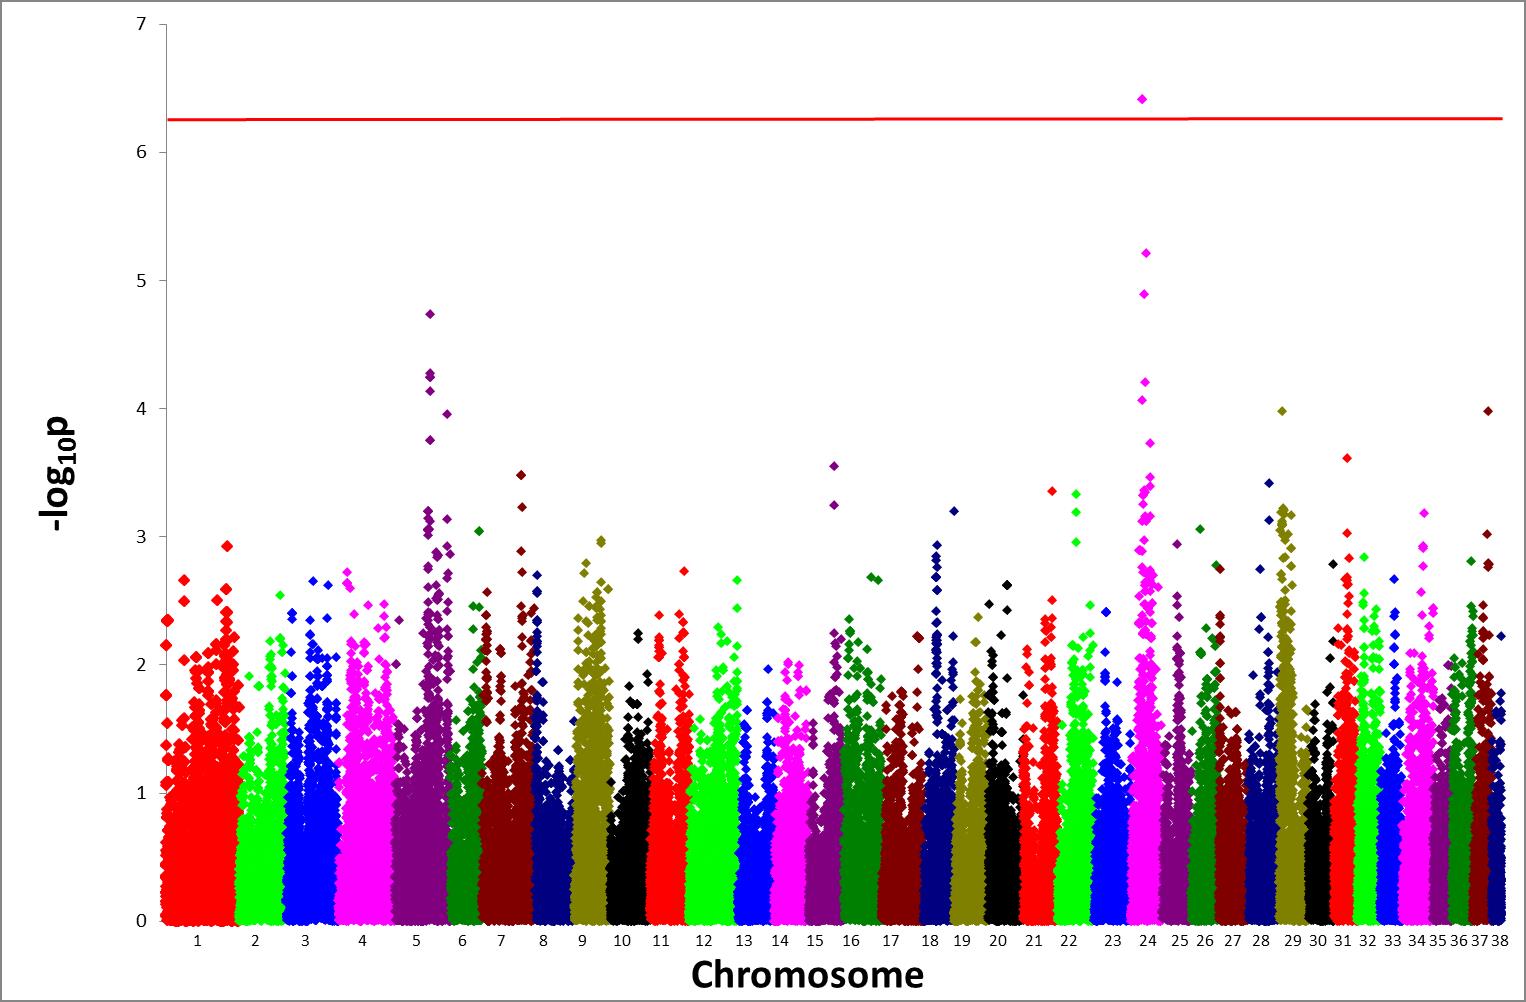
Figure 1.
Manhattan plot for GWAS Analysis 4 (Cases: PCAG cases; Controls: PLA cases) in the European BH. The horizontal red line denotes the threshold for genome-wide statistical association.
 Figure 1 of
Oliver, Mol Vis 2019; 25:93-105.
Figure 1 of
Oliver, Mol Vis 2019; 25:93-105.