Figure 4. Diagrammatic representation and conservational analyses. A: Diagrammatic representation of the 14 identified mutations in the context of genome structure (upper) and eight isoforms
of the OPA1 protein (below), derived from the alternative splicing of exons 4, 4b, 5, and 5b. The OPA1 protein includes a
mitochondria-targeting sequence (MTS), a GTPase domain, a middle domain, and a C-terminus GTPase effector domain (GED). B: Orthologous protein sequence alignment of OPA1 from human (H. sapiens), chimpanzees (P. troglodytes), cows (B. taurus), rats (M. musculus), chickens (G. gallus), zebrafish (D. rerio), fruit flies (D. melanogaster), and roundworms (C. elegans).
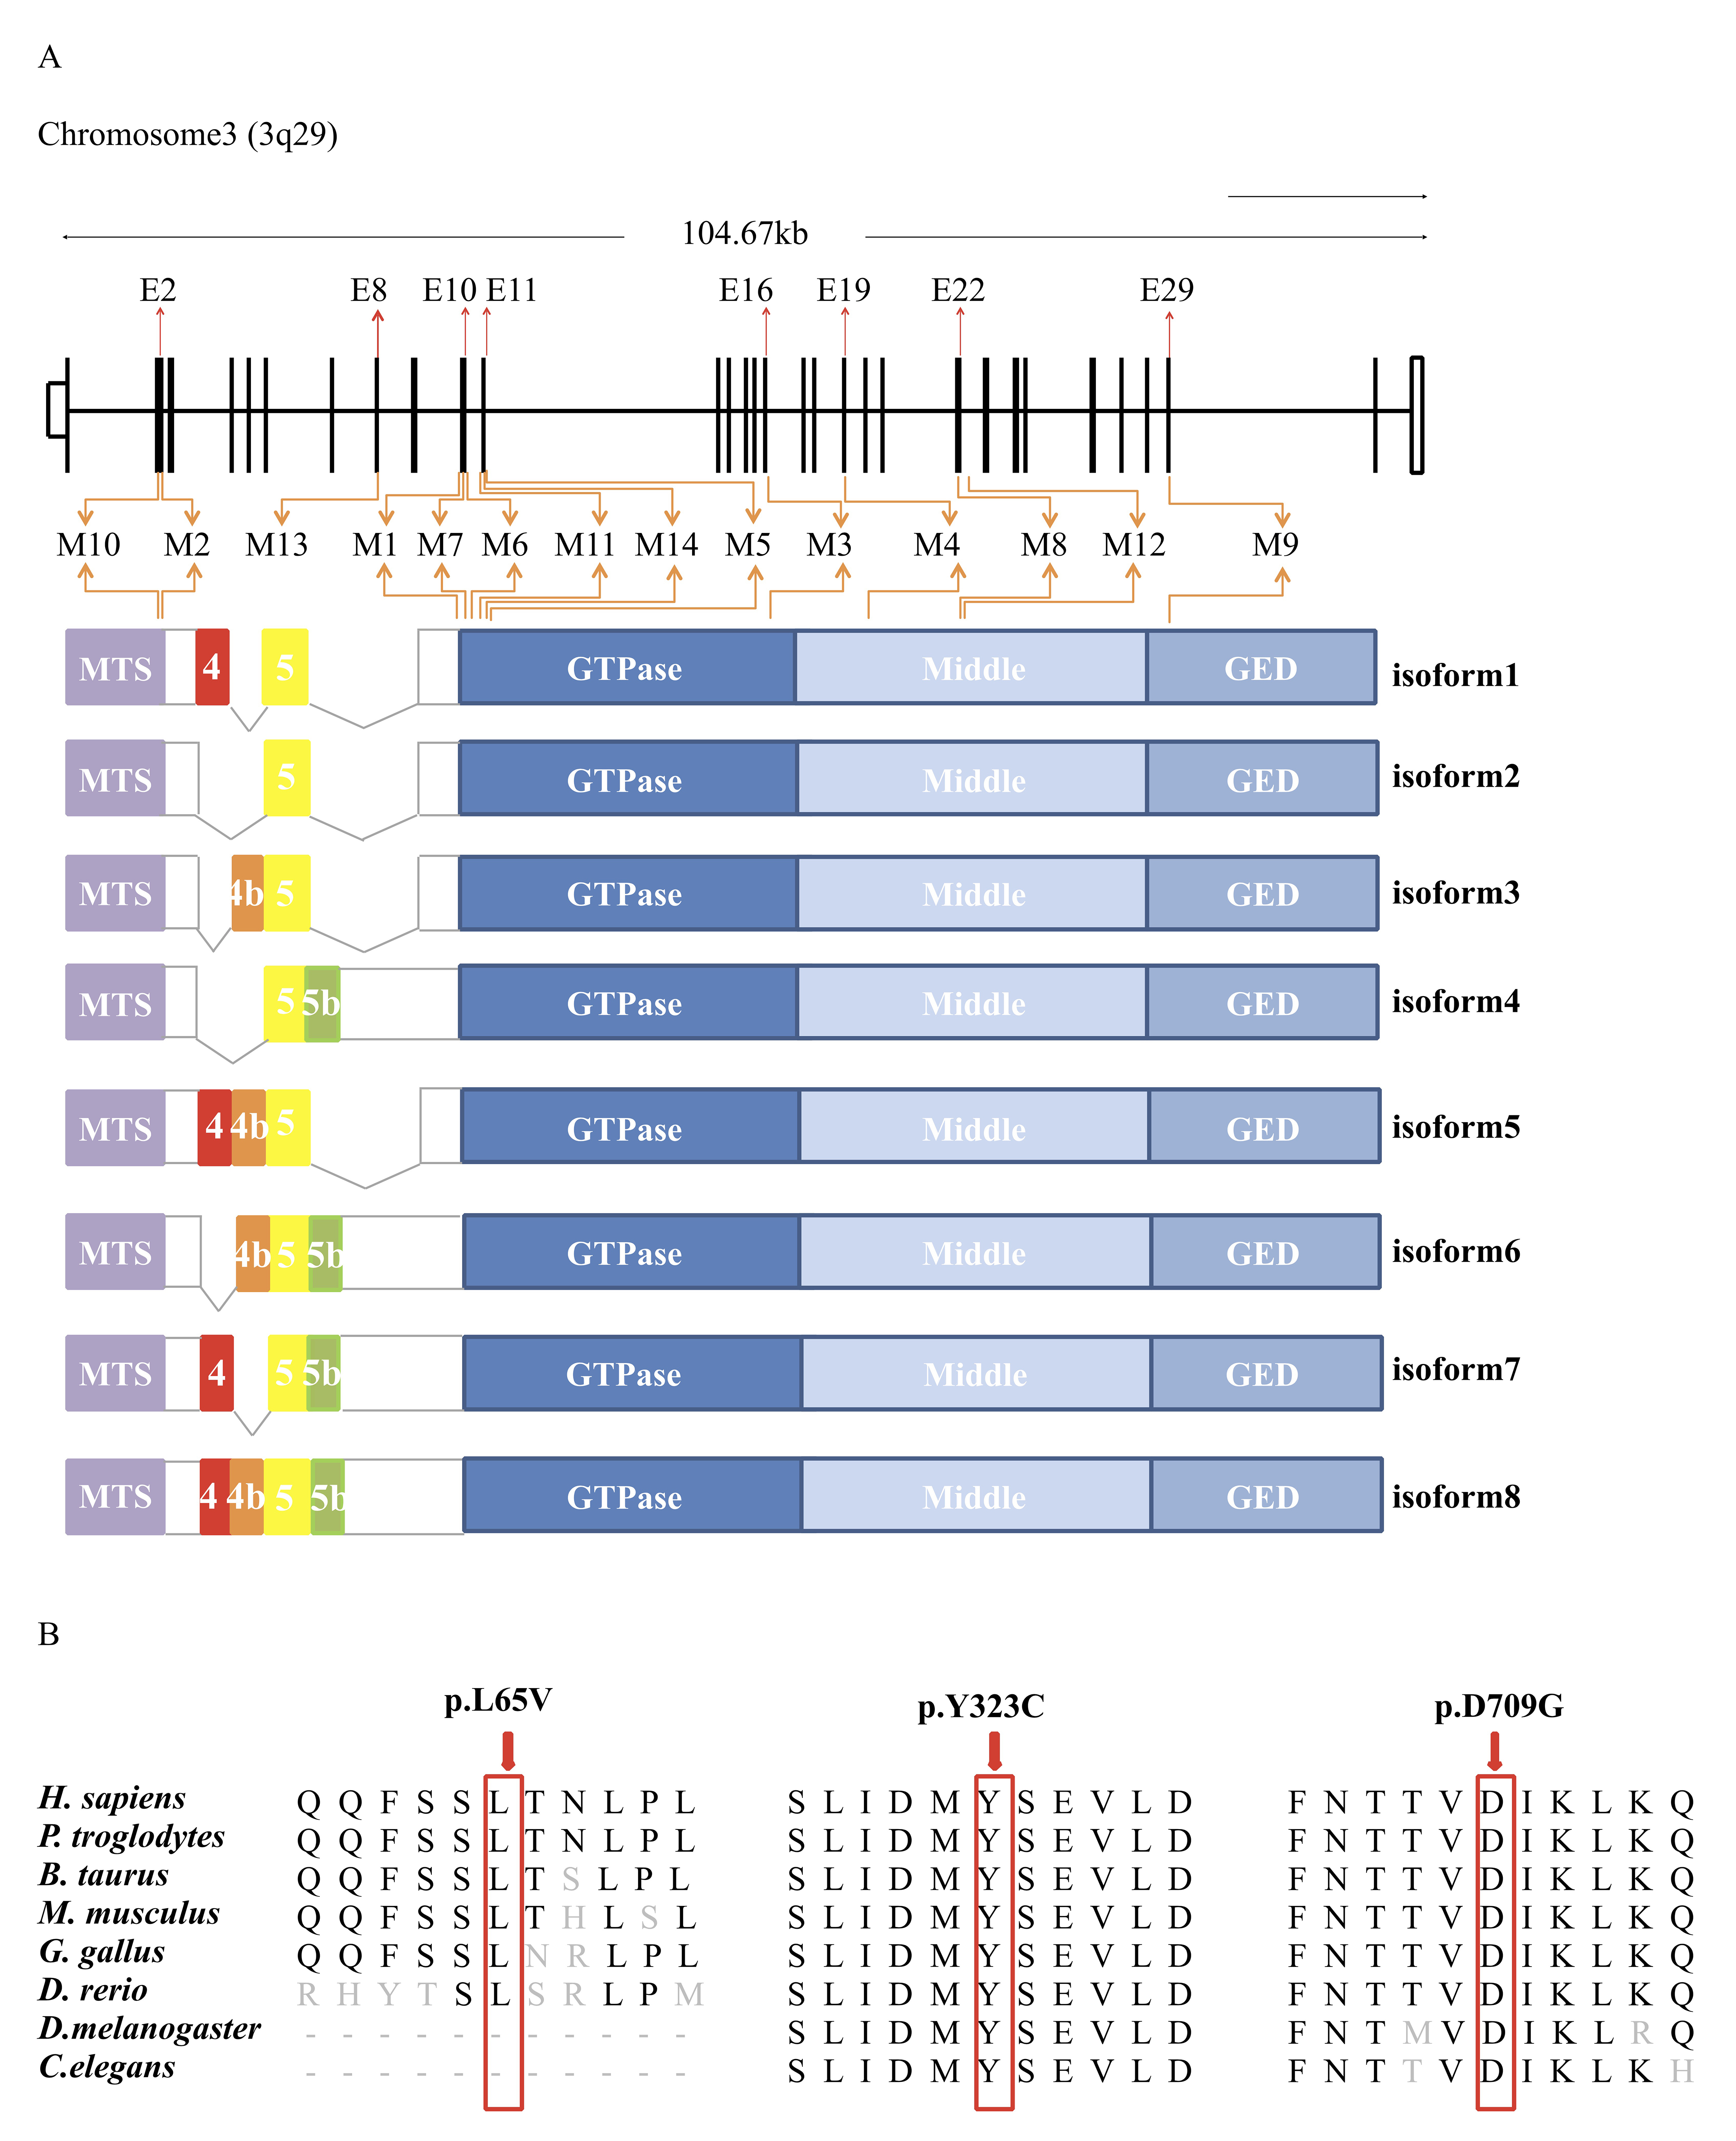
 Figure 4 of
Wang, Mol Vis 2019; 25:912-920.
Figure 4 of
Wang, Mol Vis 2019; 25:912-920.