Figure 4. Colocalization of PGRN and Iba-1 positive macrophages and microglia. A: The expression of progranulin (PGRN) and macrophage and microglia marker (Iba-1) was colocalized after light exposure in
the ONL. B: An enlarged image is shown. C: The panel shows the representative micrograph of a hematoxylin and eosin–stained retina from a ddY mouse. D: Light exposure enhanced the number of PGRN+ Iba-1+ double-positive cells in the ONL. Data are shown as mean ± standard error of the mean (SEM; n=3). **, p<0.01 versus normal
(Dunnett’s test). ONL, outer nuclear layer; INL, inner nuclear layer; GCL, ganglion cell layer; Pg, PGRN; Nor, normal. Scale
bars = 50 µm (A, C), and 20 µm (B).
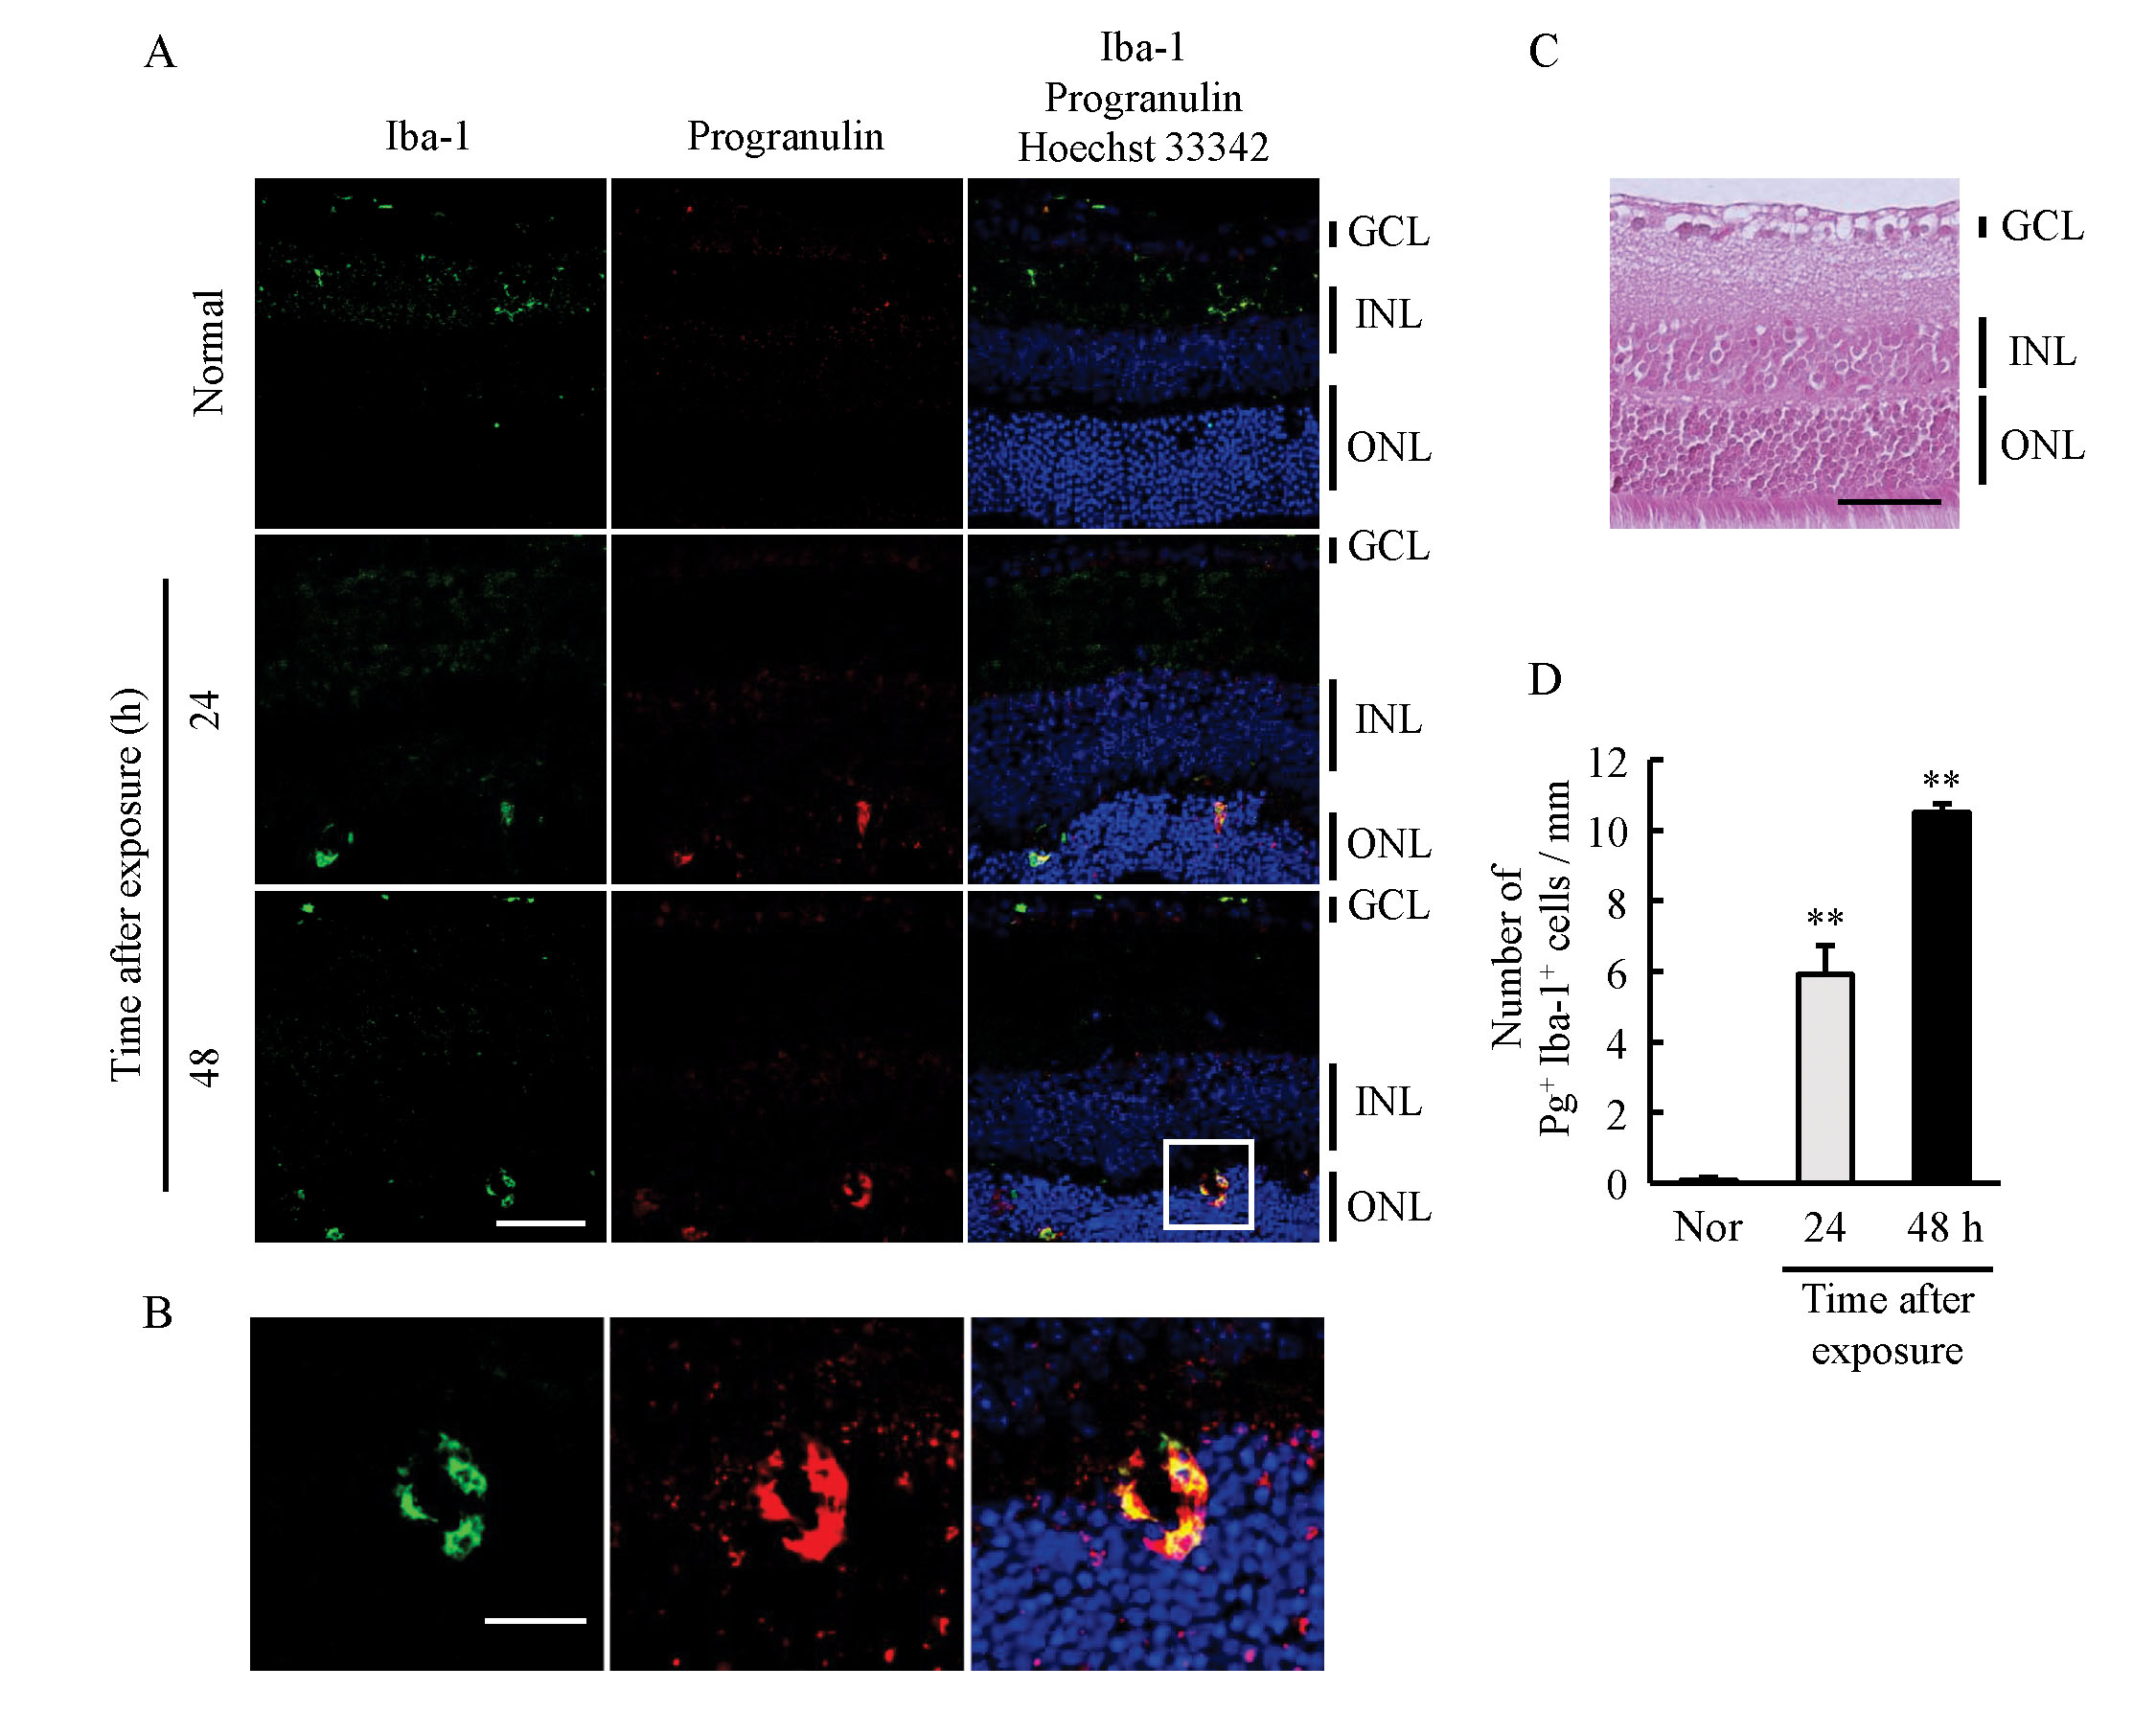
 Figure 4 of
Tanaka, Mol Vis 2019; 25:902-911.
Figure 4 of
Tanaka, Mol Vis 2019; 25:902-911.