Figure 3. Expression of PGRN and granulins after excess light exposure. A: Schematic of the experimental protocol. Albino male mice were exposed to white light at 8,000 lux for 3 h. Then western
blotting and immunostaining were performed 24 and 48 h after light exposure, respectively. B: The arrowhead and arrow indicate the progranulin (PGRN) and granulin bands, respectively. Quantification analysis shows
the expression levels of granulins (C), granulins/PGRN (E), secretory leukocyte protease inhibitor (SLPI) (F), and Iba-1 (G) were increased in the retina after light exposure. The increasing tendency was observed in the PGRN expression level (D). Data are shown as mean ± standard error of the mean (SEM; n=5). *, p<0.05 versus normal (Dunnett’s test).
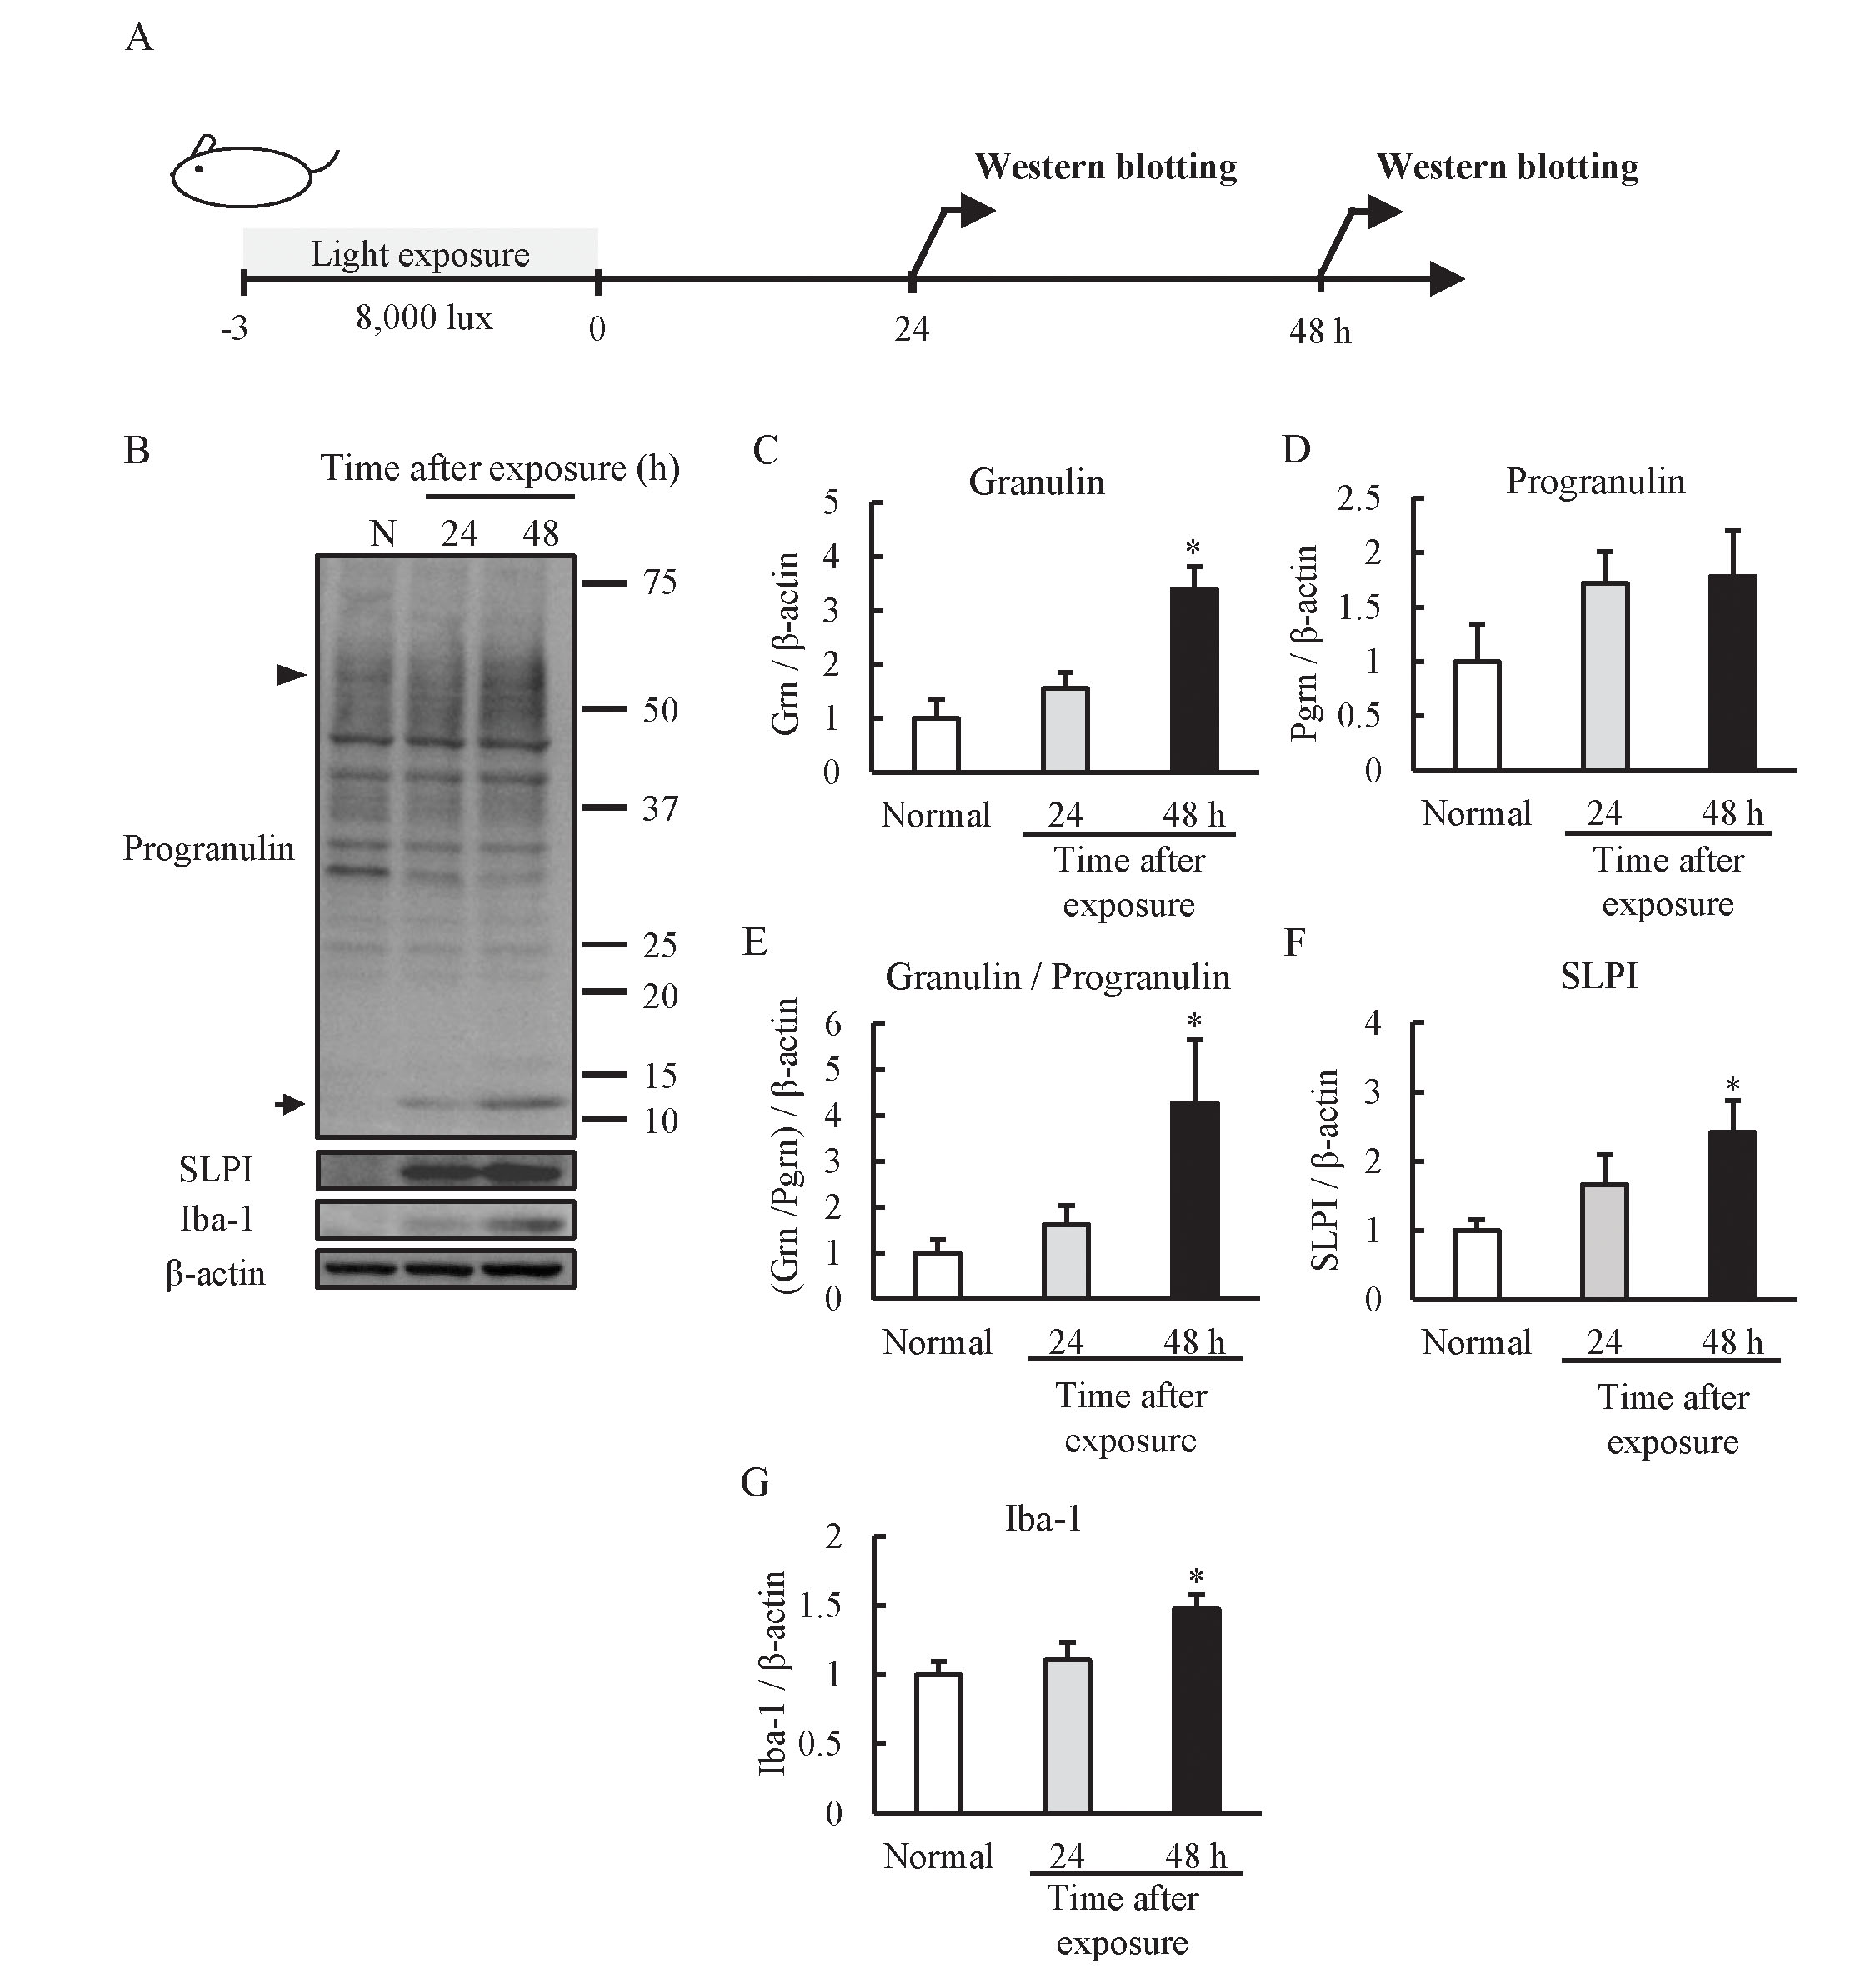
 Figure 3 of
Tanaka, Mol Vis 2019; 25:902-911.
Figure 3 of
Tanaka, Mol Vis 2019; 25:902-911.