Figure 4. Comparison of dark-adapted ERG from Grm6nob8 and Grm6nob3/nob8 mice at P15 and P21. Flash strength (in log cd s/m2) is indicated on the left of each set of waveforms. At P15, no obvious b-wave was detected either from the Grm6nob8 or the Grm6nob3/nob8 mice. At P21, a clear albeit reduced b-wave is present in all animals, with a greater reduction observed in the Grm6nob3/nob8 mice when compared to the Grm6nob8 mice.
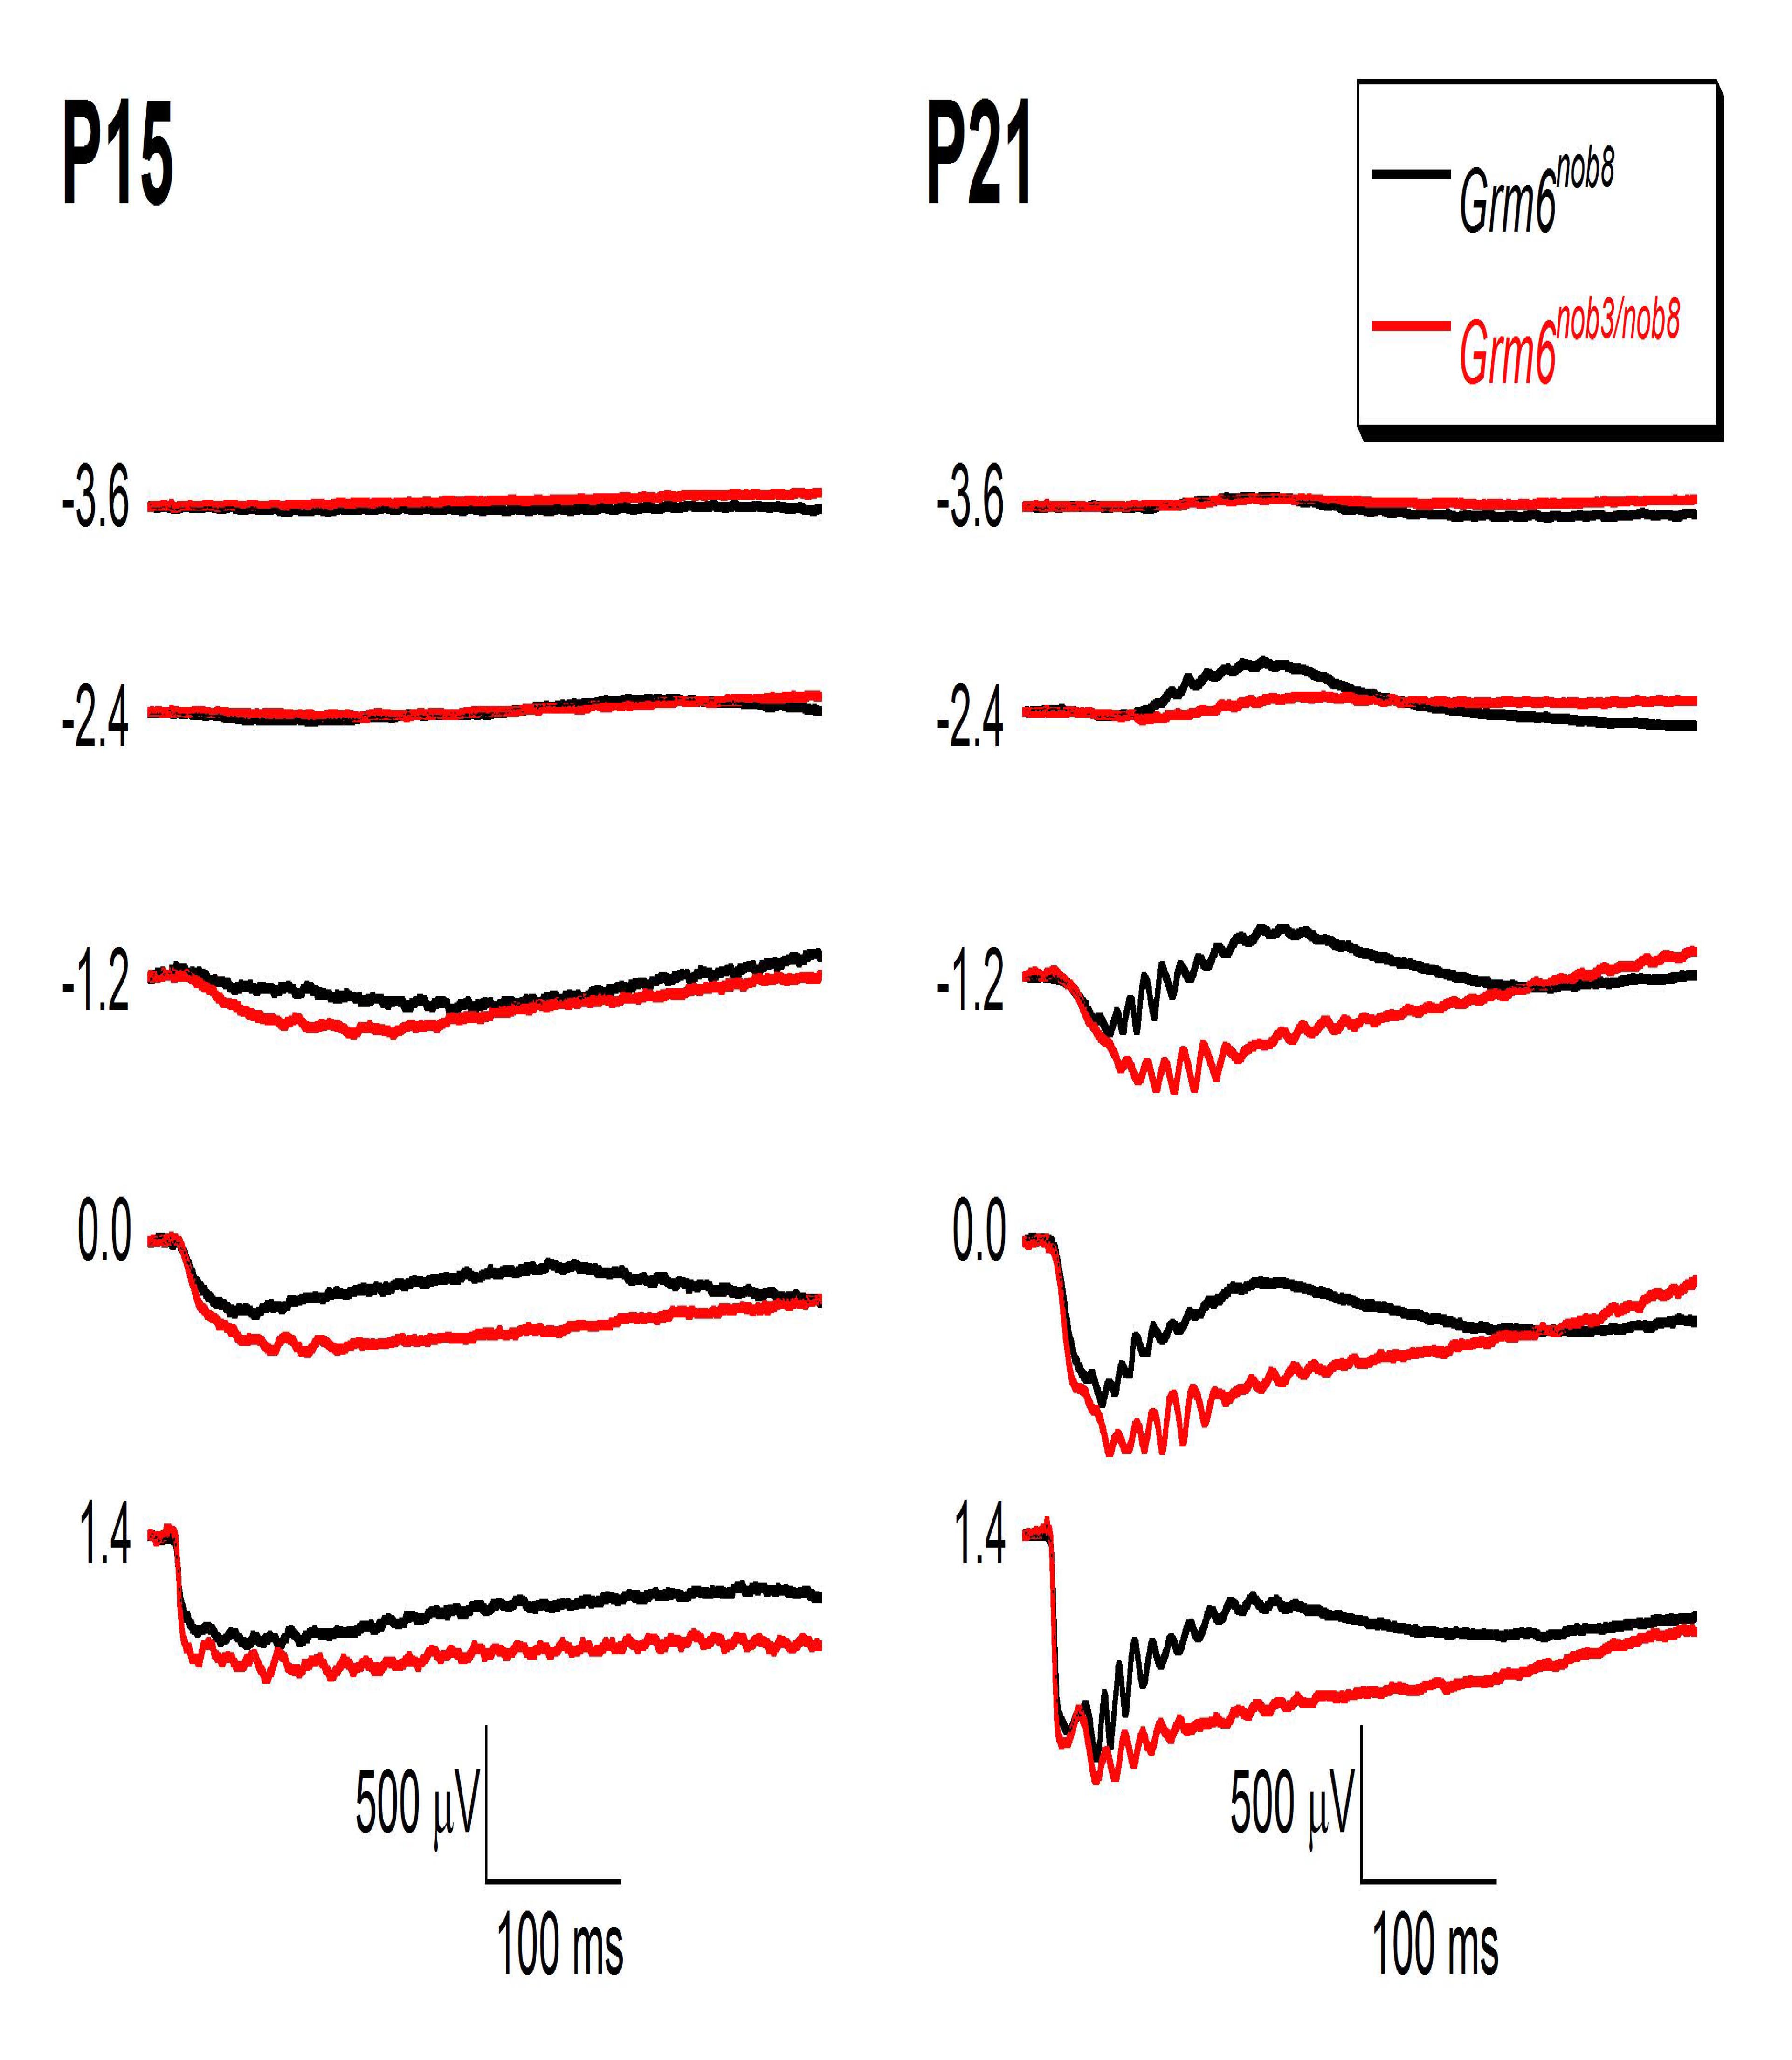
 Figure 4 of
Kinoshita, Mol Vis 2019; 25:890-901.
Figure 4 of
Kinoshita, Mol Vis 2019; 25:890-901.