Figure 3. Comparison of ERGs from control, Grm6nob8, and Grm6nob3/nob8 mice at P28. ERGs were elicited under dark-adapted (A) or light-adapted (C) condition. Flash strength (in log cd s/m2) is indicated on the left of each set of waveforms. B: Amplitude of dark-adapted a- and b-waves plotted as a function of flash luminance. D: Amplitude of light-adapted b-wave plotted as a function of flash luminance. In B and D, each plot indicates average +/− standard error of four (Grm6nob8) or six (Grm6nob3/nob8) mice. Repeated-measures ANOVA (ANOVA) was used to compare response functions. Compared to the Grm6nob8 mice, the Grm6nob3/nob8 mice showed comparable a-wave (p>0.05) and reduced b-wave (*p<0.01) under the dark-adapted condition. The difference in the
amplitude of the light-adapted b-wave was not statistically significant between groups (p>0.05).
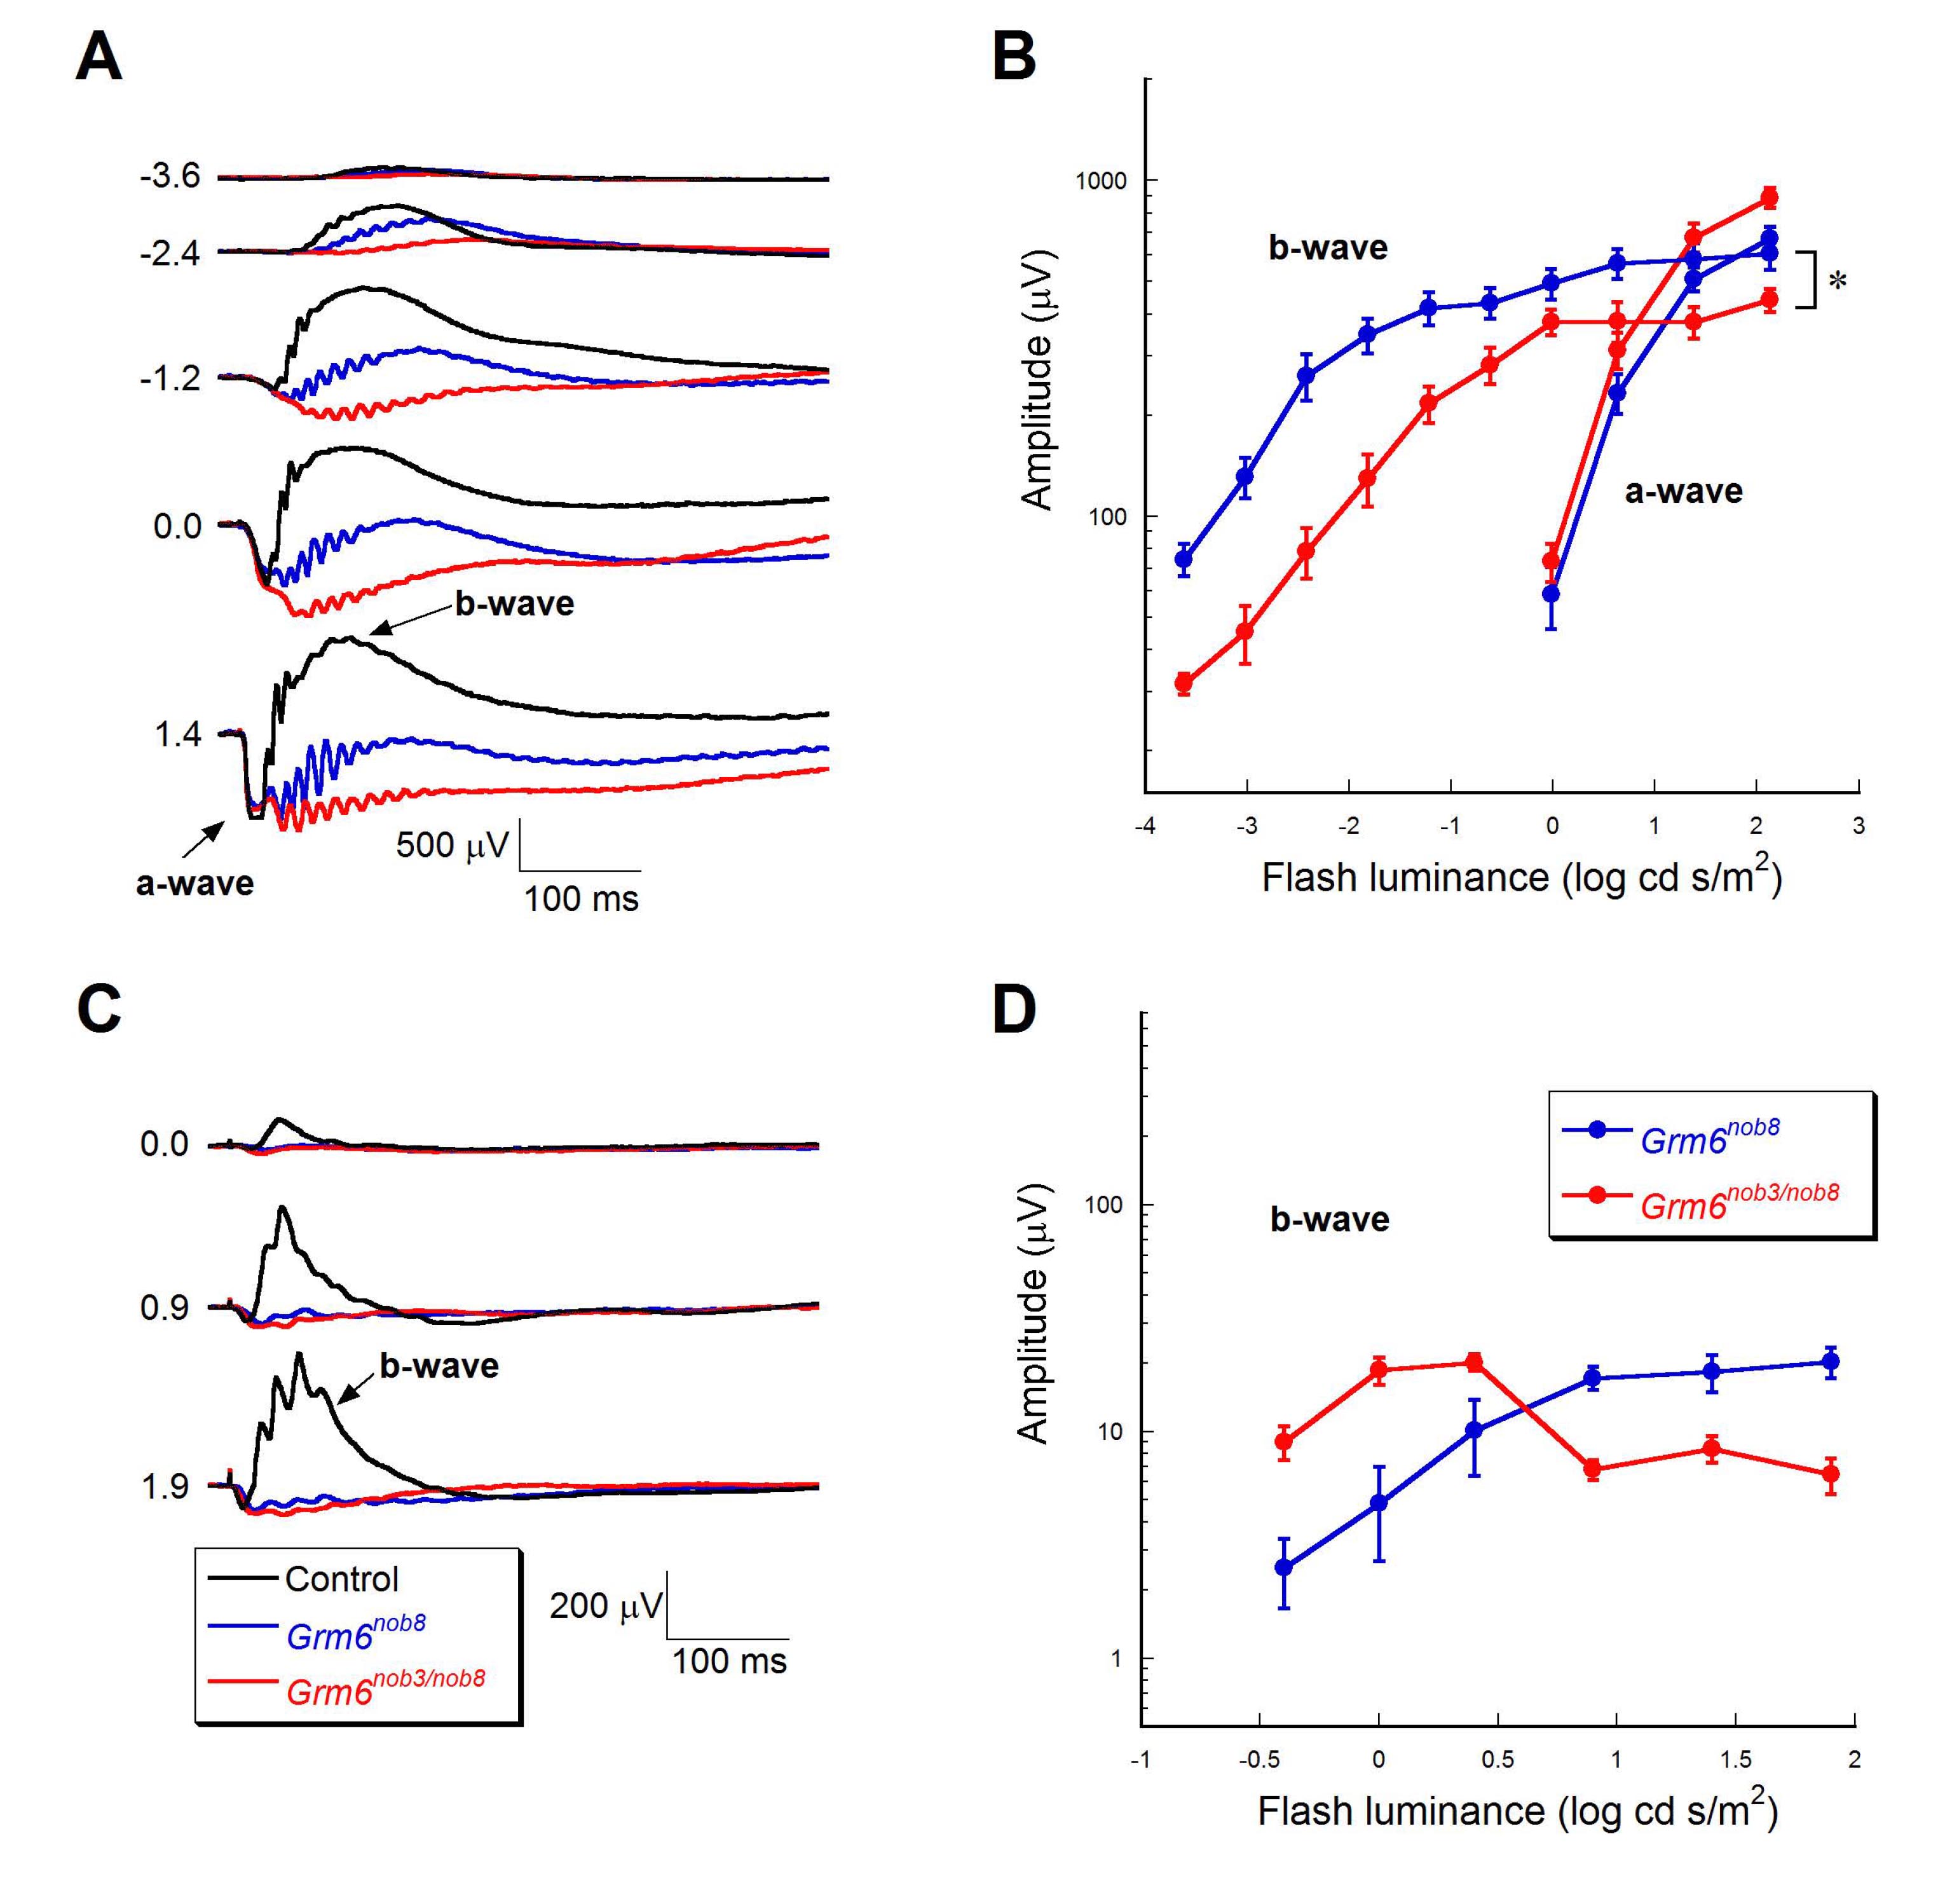
 Figure 3 of
Kinoshita, Mol Vis 2019; 25:890-901.
Figure 3 of
Kinoshita, Mol Vis 2019; 25:890-901.