Figure 2. Cellular localization of mGluR6 and PKCα in retinas from the mice at 4 weeks of age. In contrast to the control retinas (A–C), the Grm6nob3/nob8 retinas (G–I) exhibited a similar mGluR6 distribution pattern to that of the Grm6nob8 retinas (D–F). Scale bars: 10 μm. OPL, outer plexiform layer.
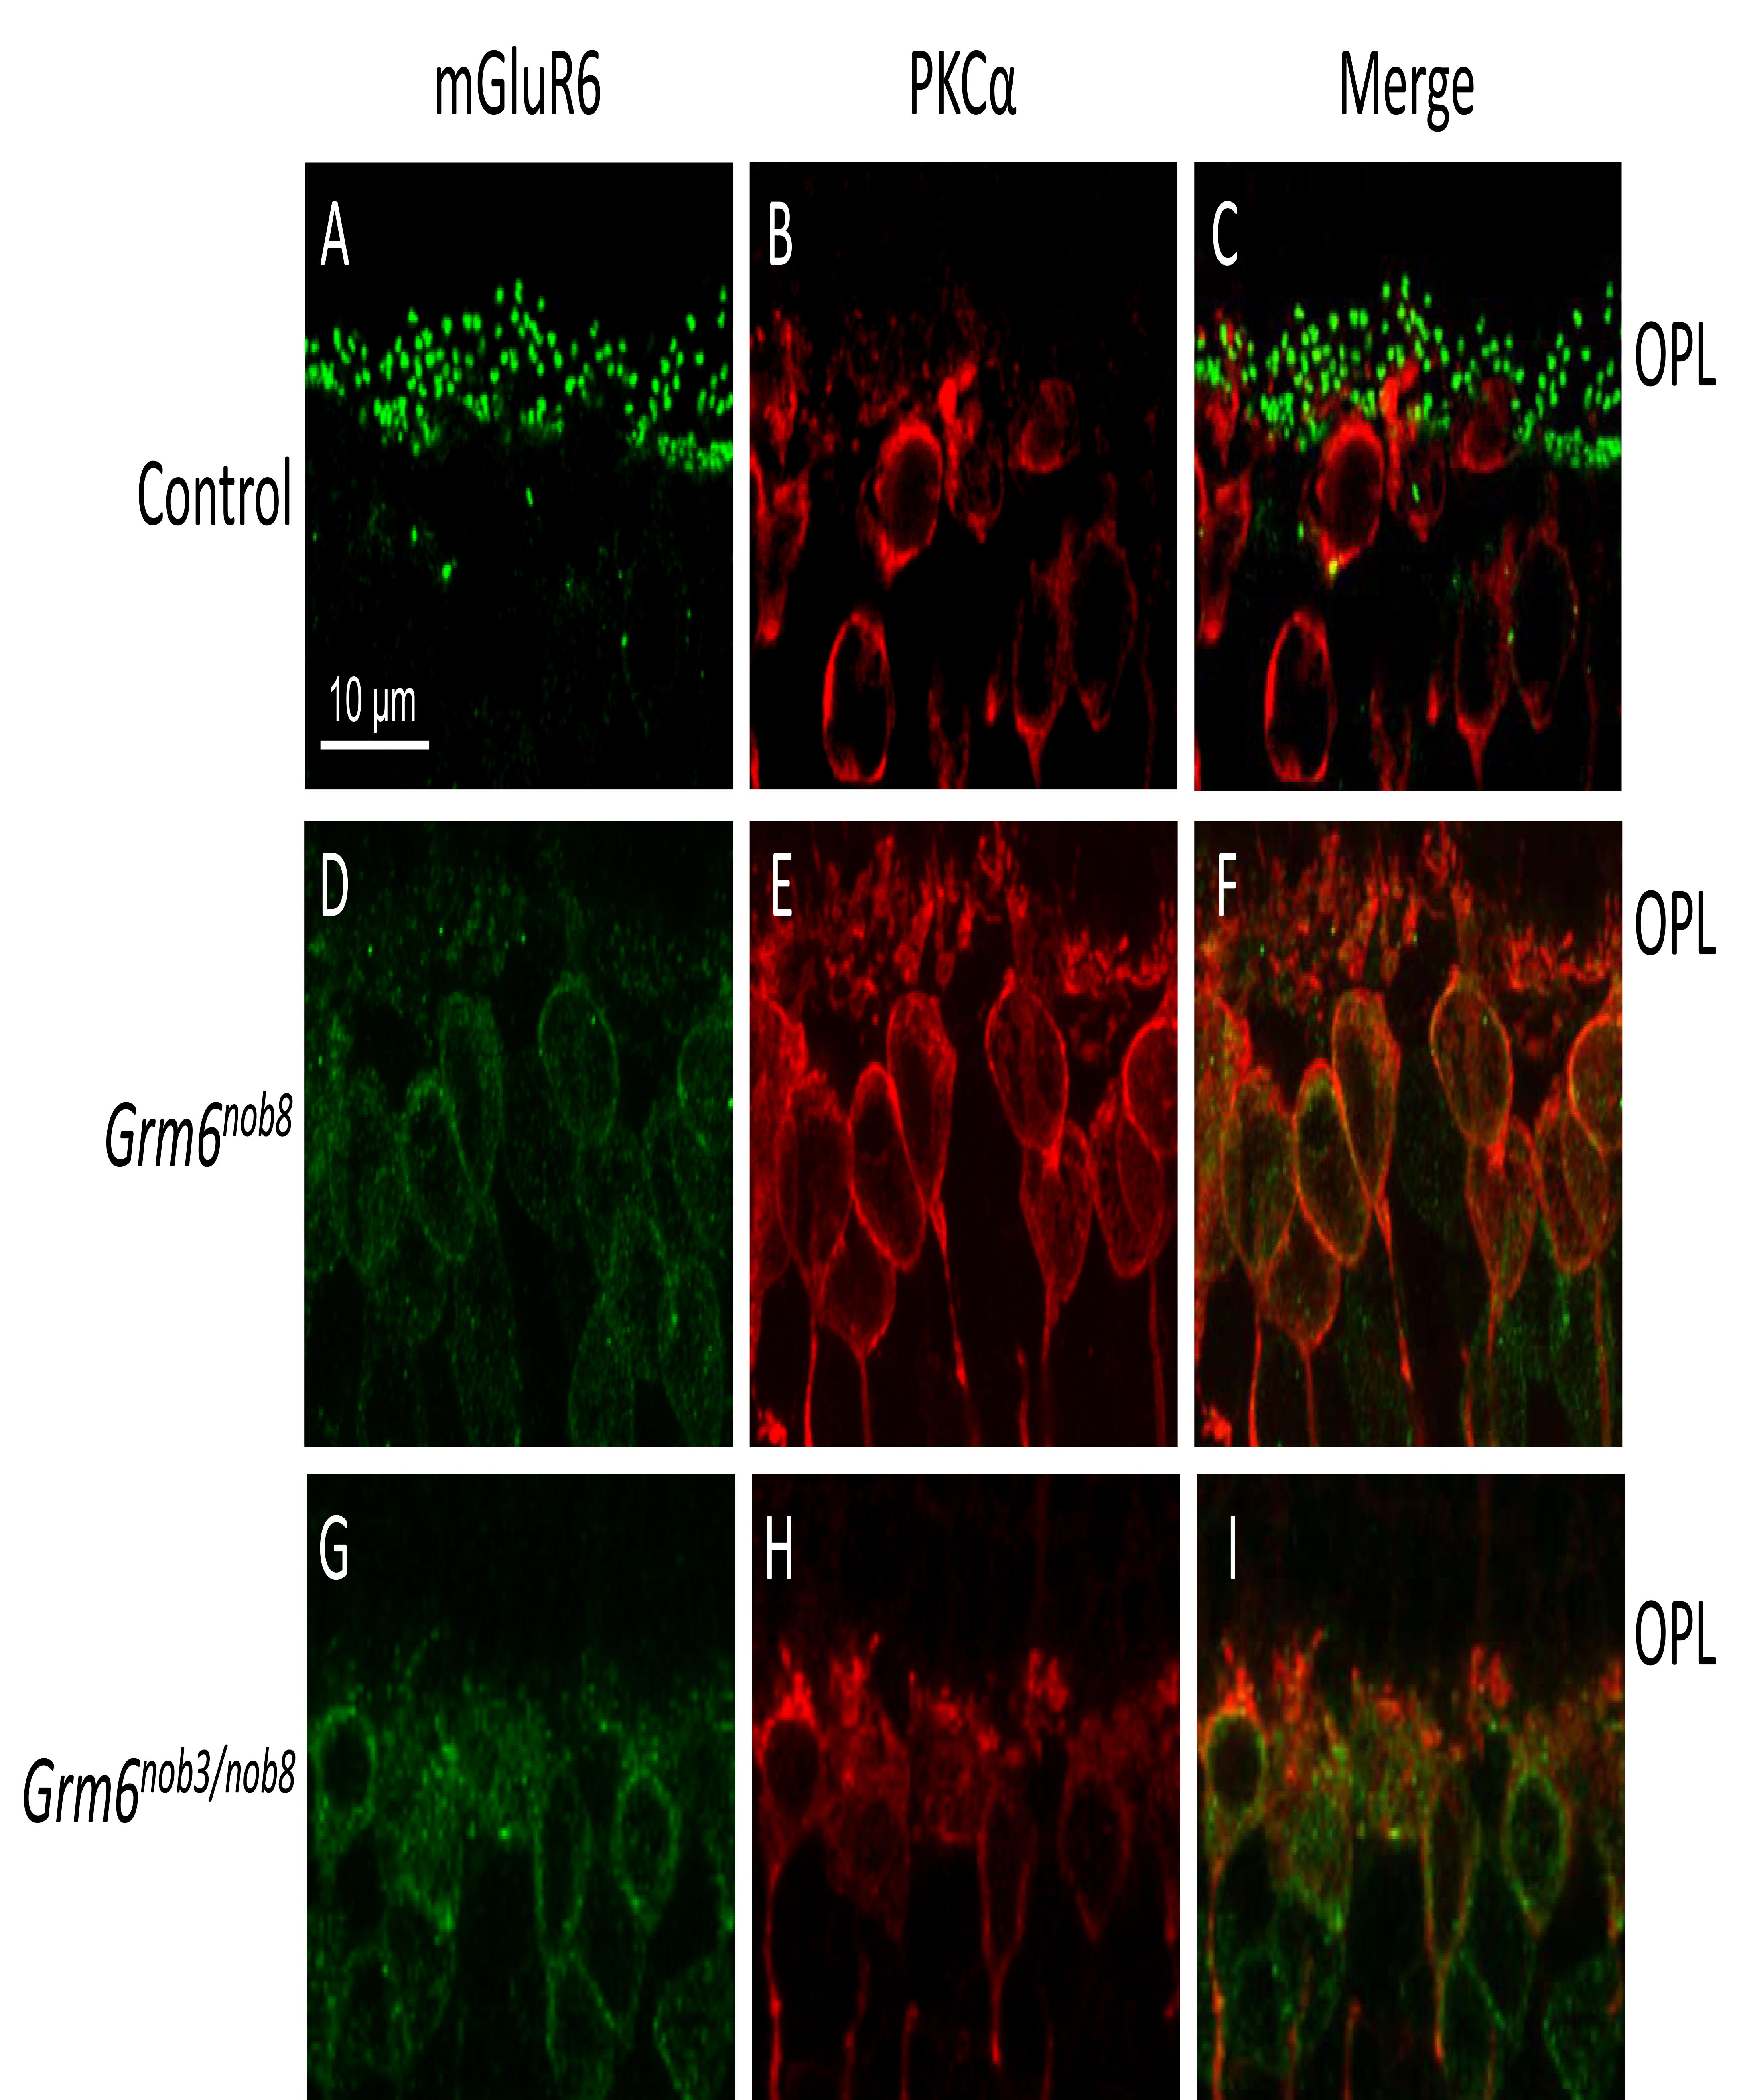
 Figure 2 of
Kinoshita, Mol Vis 2019; 25:890-901.
Figure 2 of
Kinoshita, Mol Vis 2019; 25:890-901.