Figure 2 of
Okazaki, Mol Vis 2019; 25:843-850.
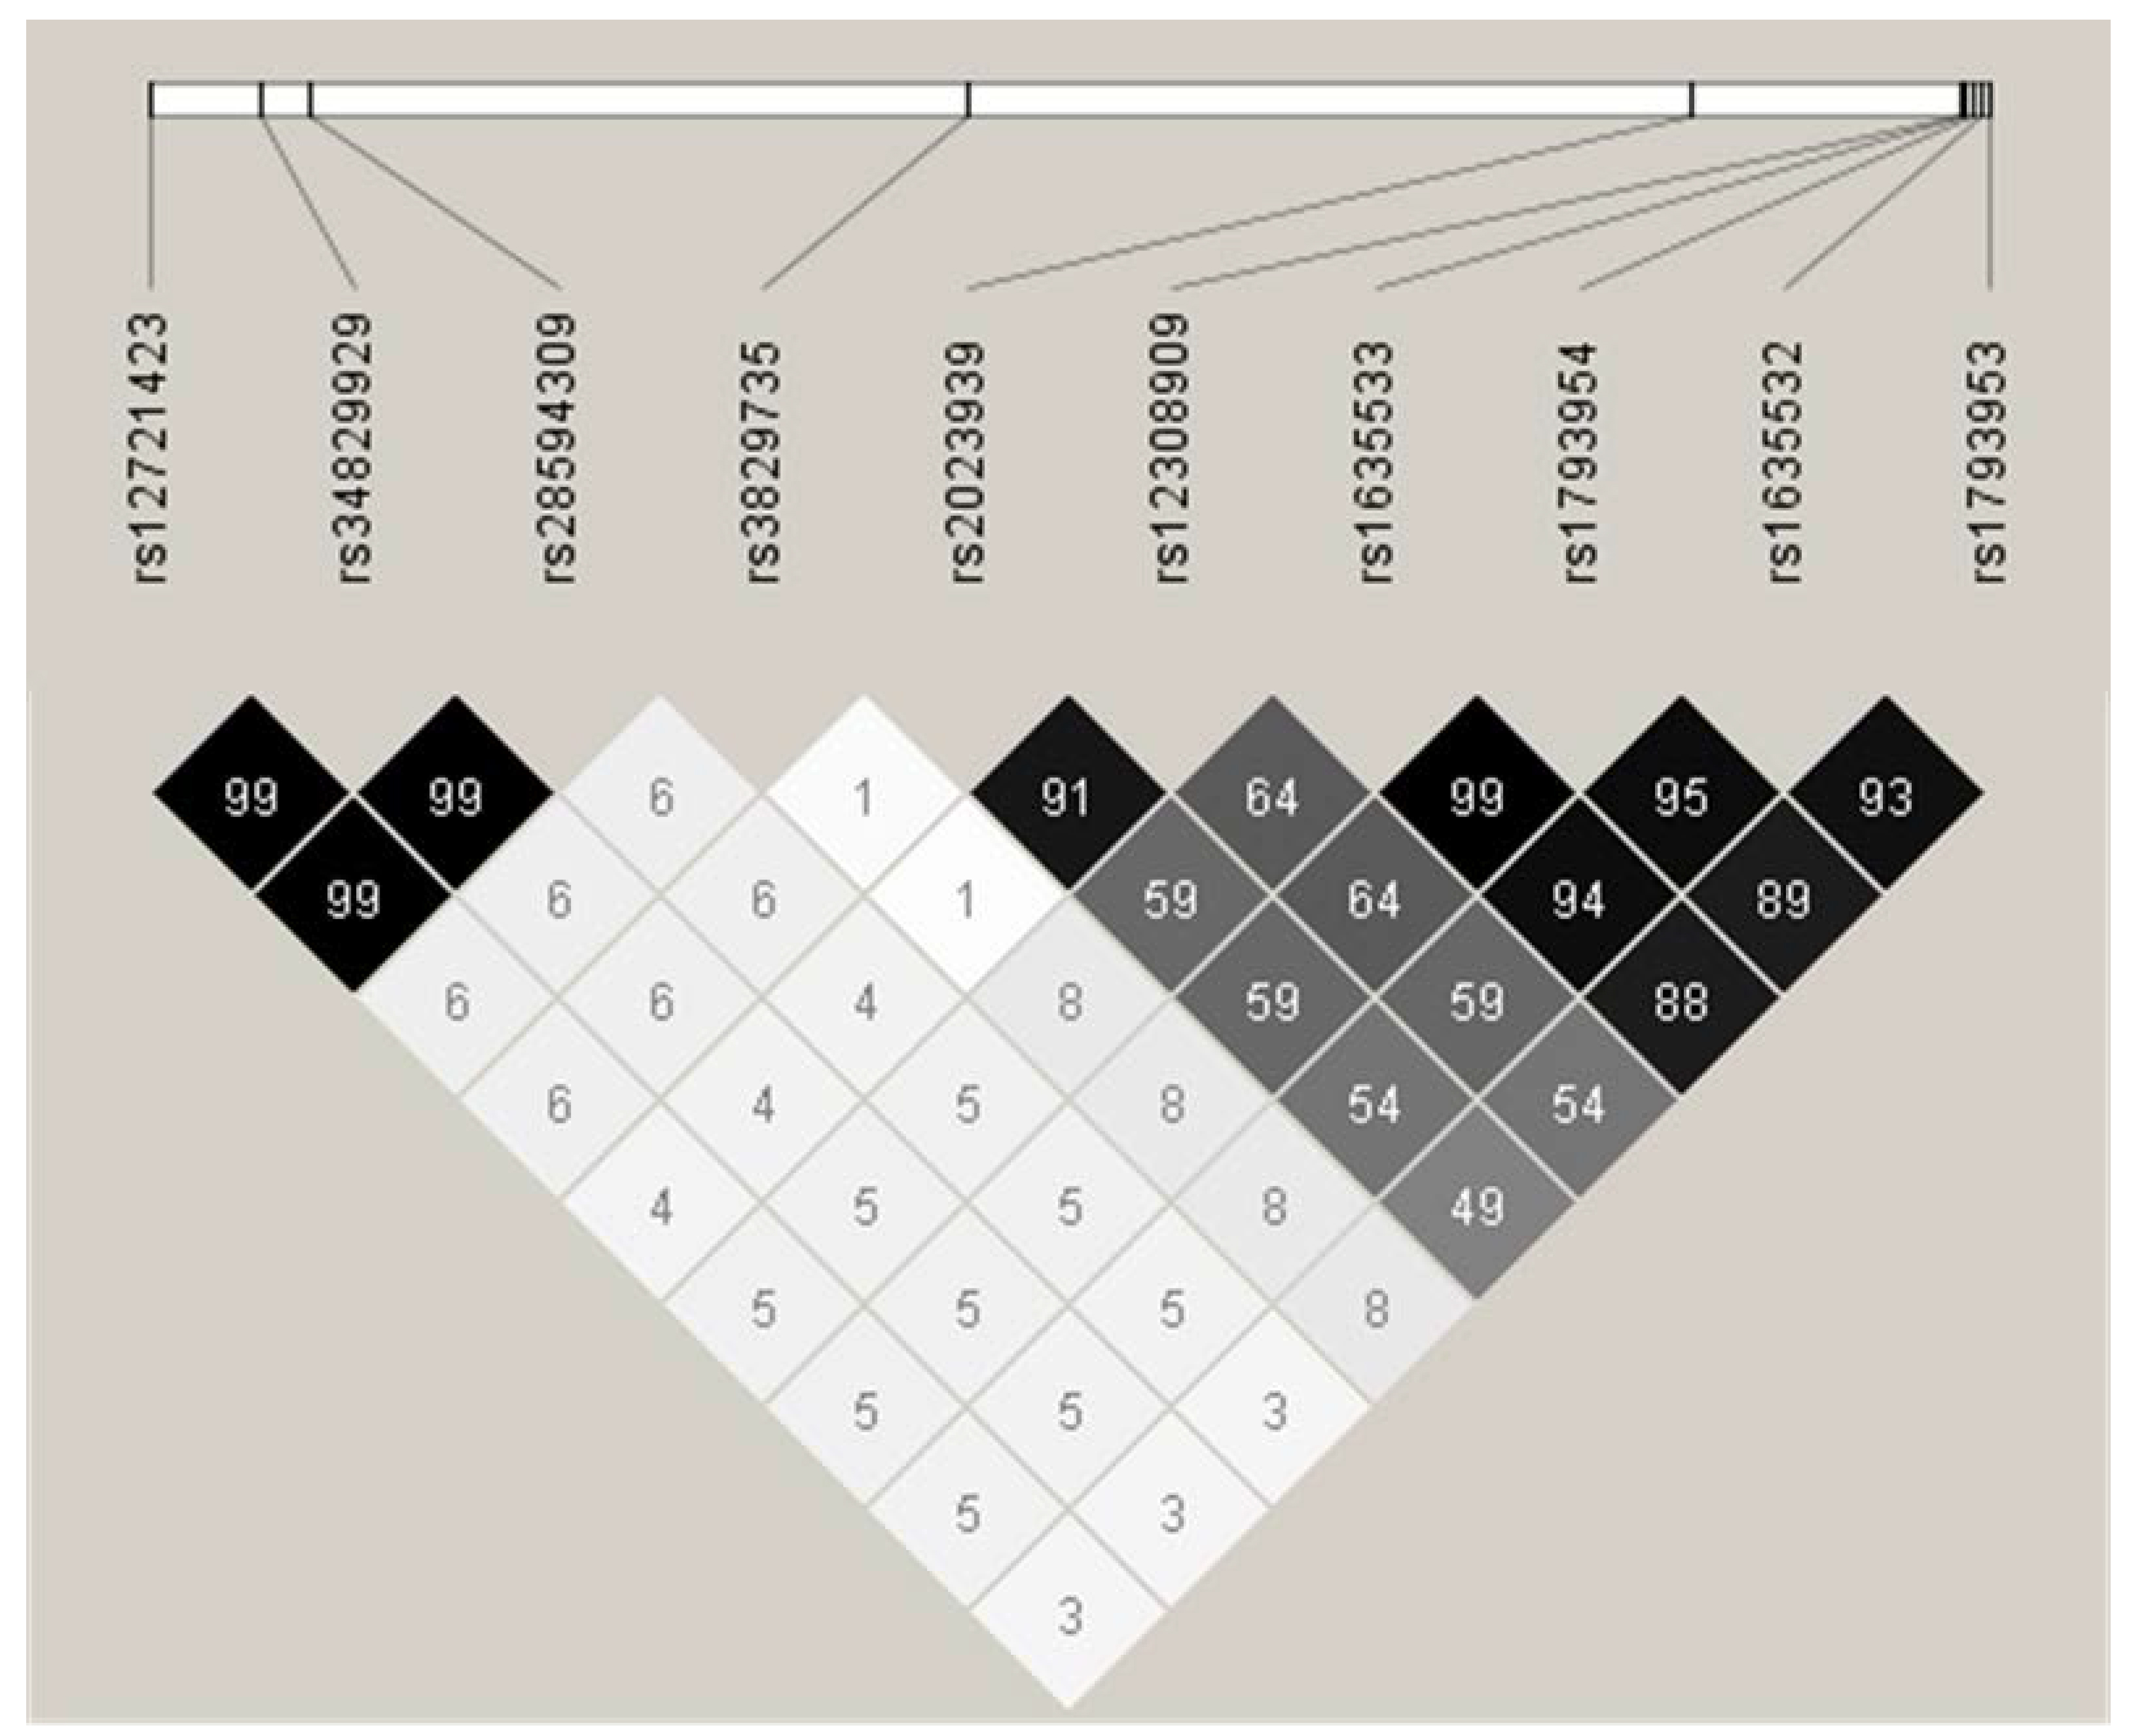
Figure 2.
LE plot of 10 SNPs with p<0.05. For each SNP pair, the corresponding
r
2
value is shown as a percentage within the respective square. Higher
r
2
values are indicated by darker shading of the square’s background.
 Figure 2 of
Okazaki, Mol Vis 2019; 25:843-850.
Figure 2 of
Okazaki, Mol Vis 2019; 25:843-850.