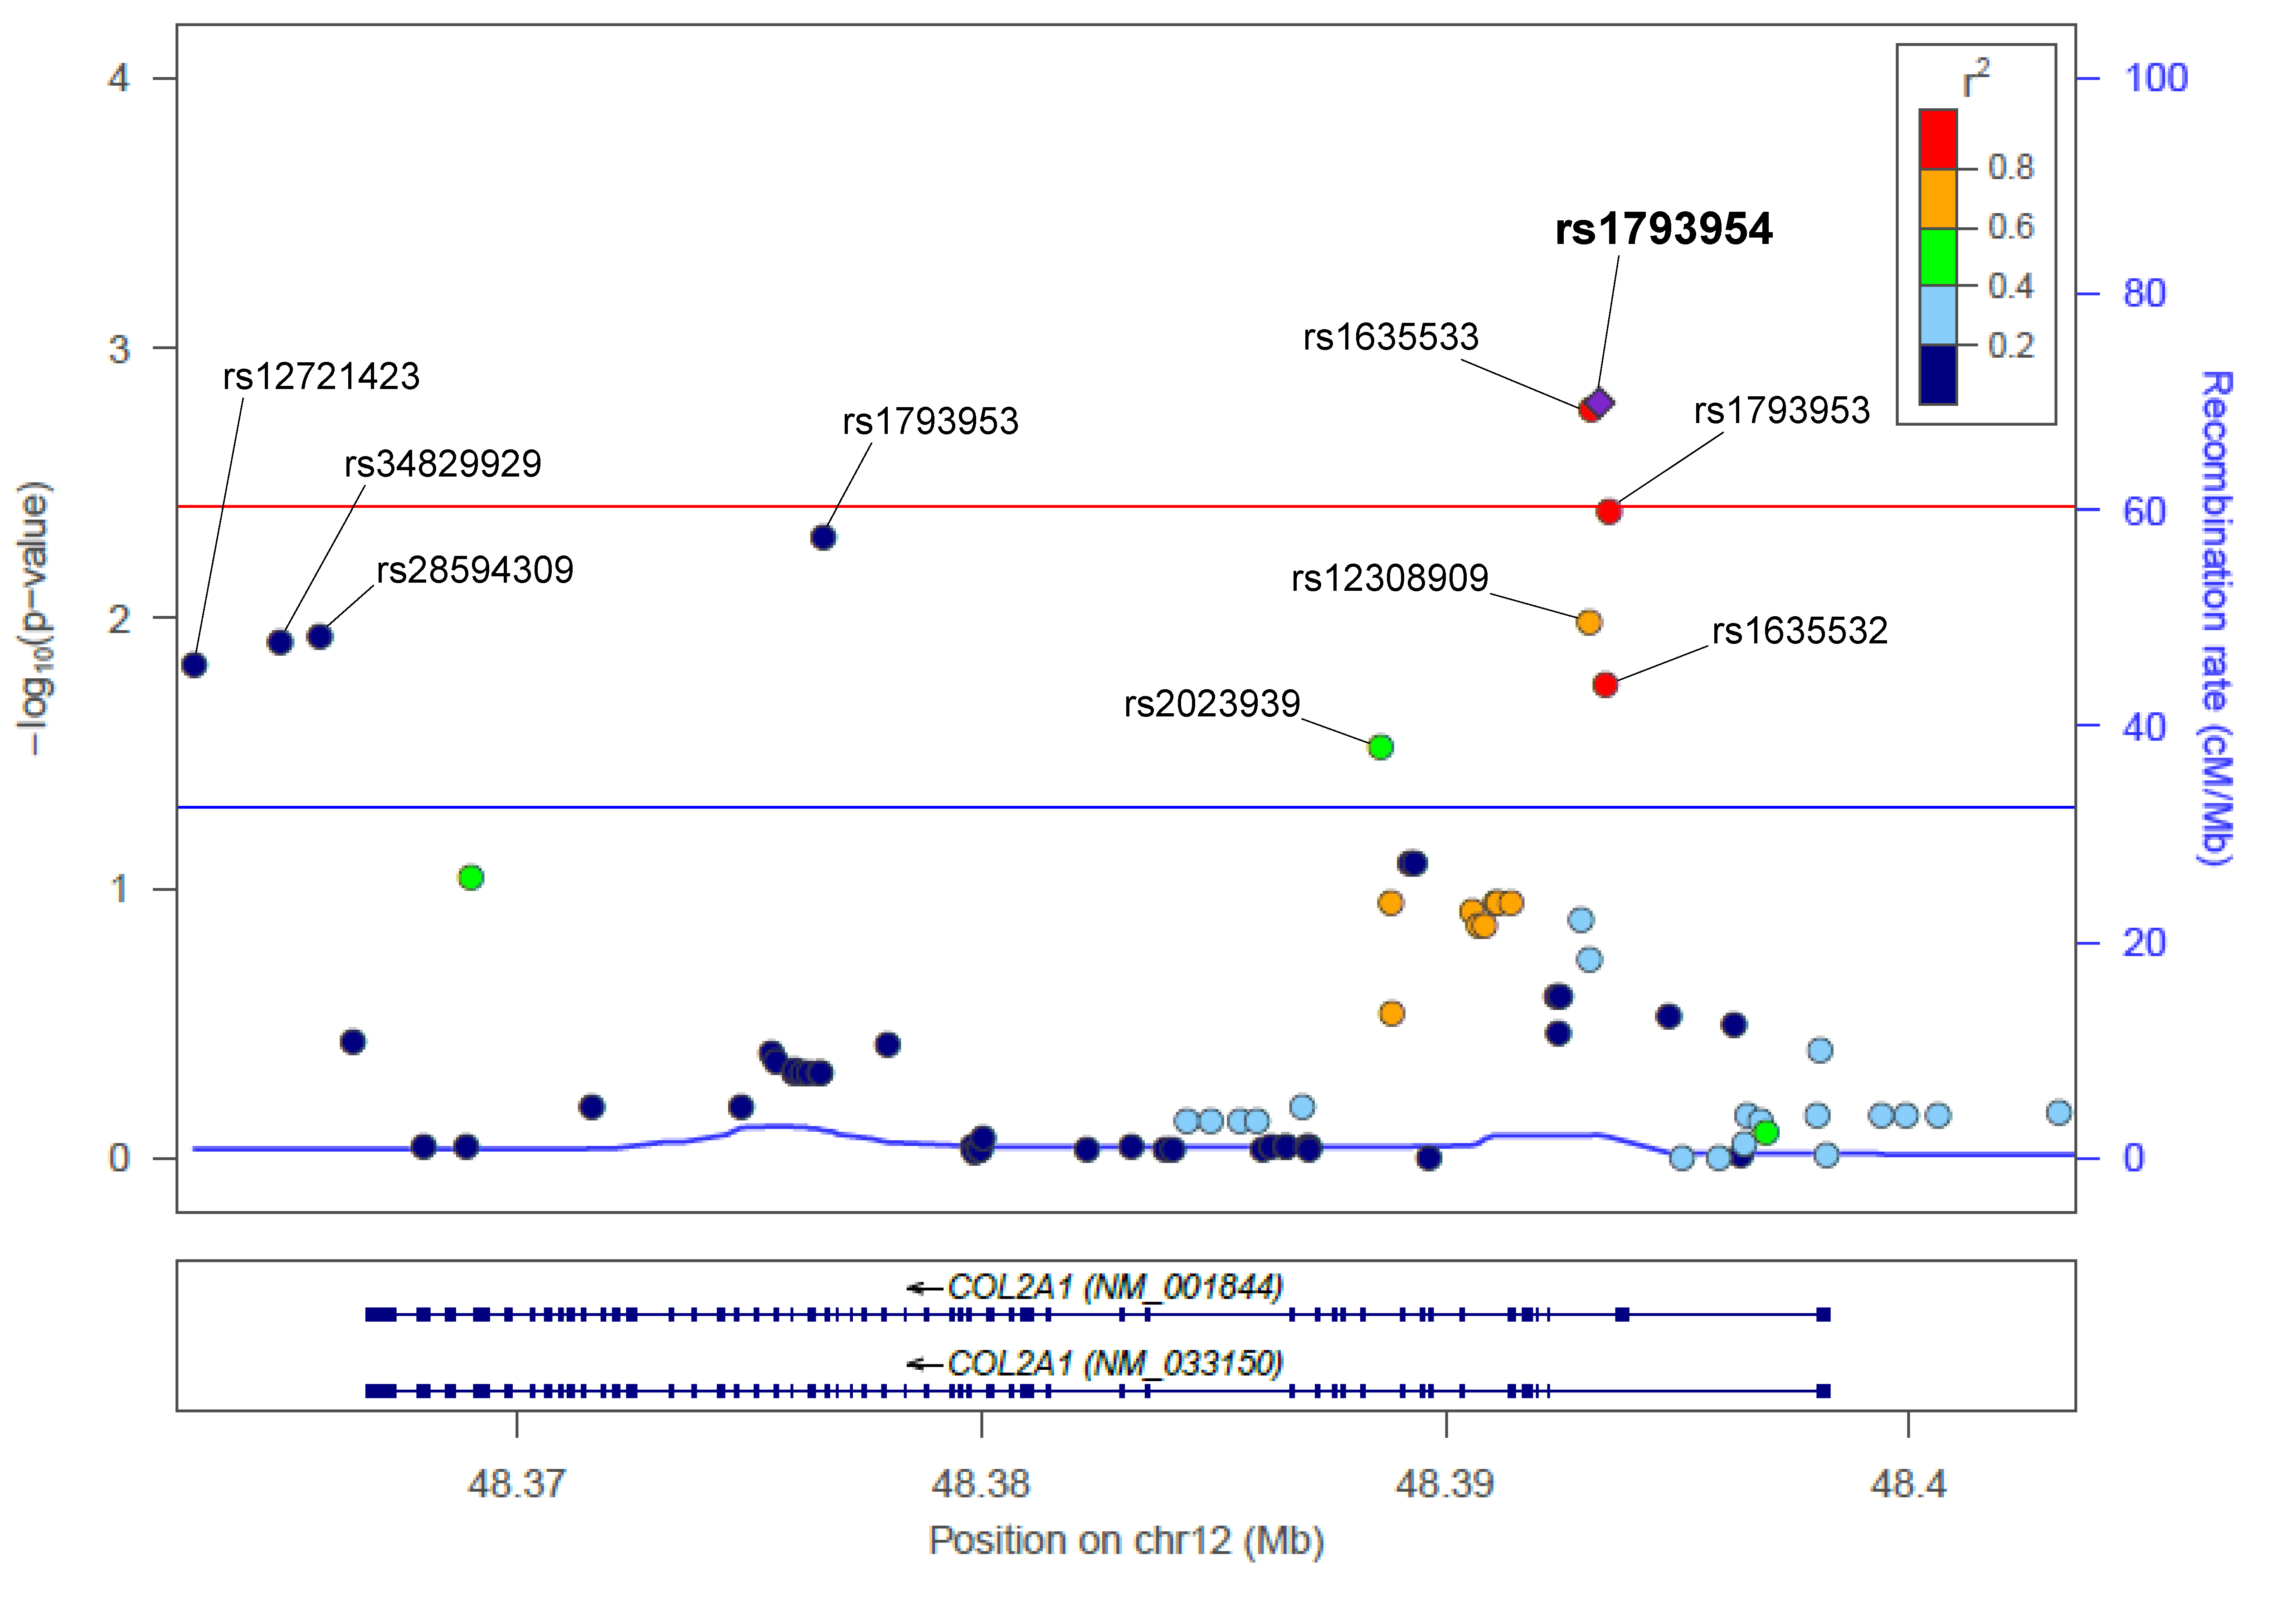
Figure 1. Allelic association results for the
COL2A1 gene region with lattice degeneration of the retina in the Japanese population. The SNP showing the strongest association
(
rs1793954) is depicted as a purple diamond. The color coding of the other SNPs indicates linkage disequilibrium (LE) with
rs1793954: red,
r2 ≥0.8; yellow, 0.6 ≤
r2 <0.8; green, 0.4 ≤
r2 <0.6; cyan, 0.2 ≤
r2 <0.4; blue,
r2 <0.2; and gray,
r2 is unknown. The left y-axis represents the −log10 p values for allelic association with lattice degeneration of the retina,
and the right y-axis represents the estimated recombination rate. The horizontal blue and red lines indicate p = 0.05 and
Pc = 0.05 (p = 0.00385 [0.05/13 SNPs]), respectively. Gene annotations are shown below the figure. The plot was created using
LocusZoom.
 Figure 1 of
Okazaki, Mol Vis 2019; 25:843-850.
Figure 1 of
Okazaki, Mol Vis 2019; 25:843-850.