Figure 4. A schematic diagram of the mutation spectrum frequency in SPATA7. The two horizontal bars represent the coding regions based on two alternative splicing isoforms. Most loss-of-function mutations
are listed on the top of the upper bar. A gross deletion involving the first five exons, four missense mutations, and two
in-frame deletions are listed under the upper bar. The line height indicates the number of mutated alleles in 60 families.
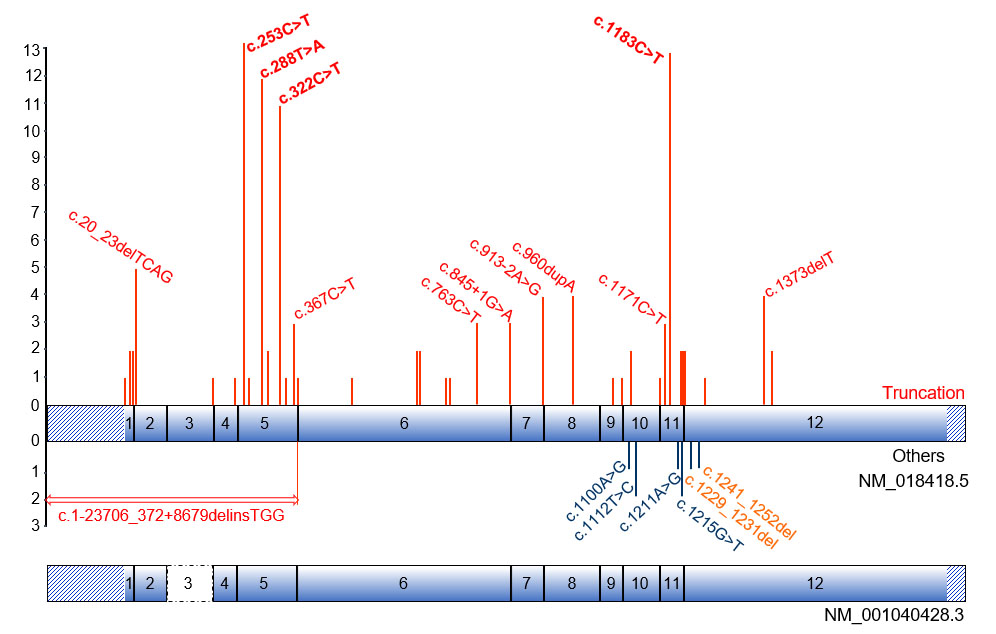
 Figure 4 of
Xiao, Mol Vis 2019; 25:821-833.
Figure 4 of
Xiao, Mol Vis 2019; 25:821-833.