Figure 3. Fundus autofluorescence, fluorescein angiography, and visual fields, 20 years later. A, F: In both eyes, fundus autofluorescence shows a central round area of decreased autofluorescence corresponding to the area
of macular atrophy, surrounded by a ring of relatively increased autofluorescence. In the mid-peripheral retina, several roundish
areas of reduced autofluorescence, suggestive of patchy atrophy, can be seen. B, C, G, H: In both eyes, fluorescein angiography frames reveal a severe macular atrophy surrounded by a ring of preserved retinal pigment
epithelium. The mid-peripheral retina is extensively atrophic with some sparse pigmentary deposits (white arrow in H). D, I: Bilateral visual field extinction. E: In the right eye, simultaneous infrared and spectral domain optical coherence tomography show an ovoid tubular structure
with a partial hyperreflective border and hyporreflective material inside, suggestive of an outer retina tabulation (white
arrow) while (J) in the left eye reveal a severe retinal thinning secondary to the atrophy of the external retinal layers with backscattering.
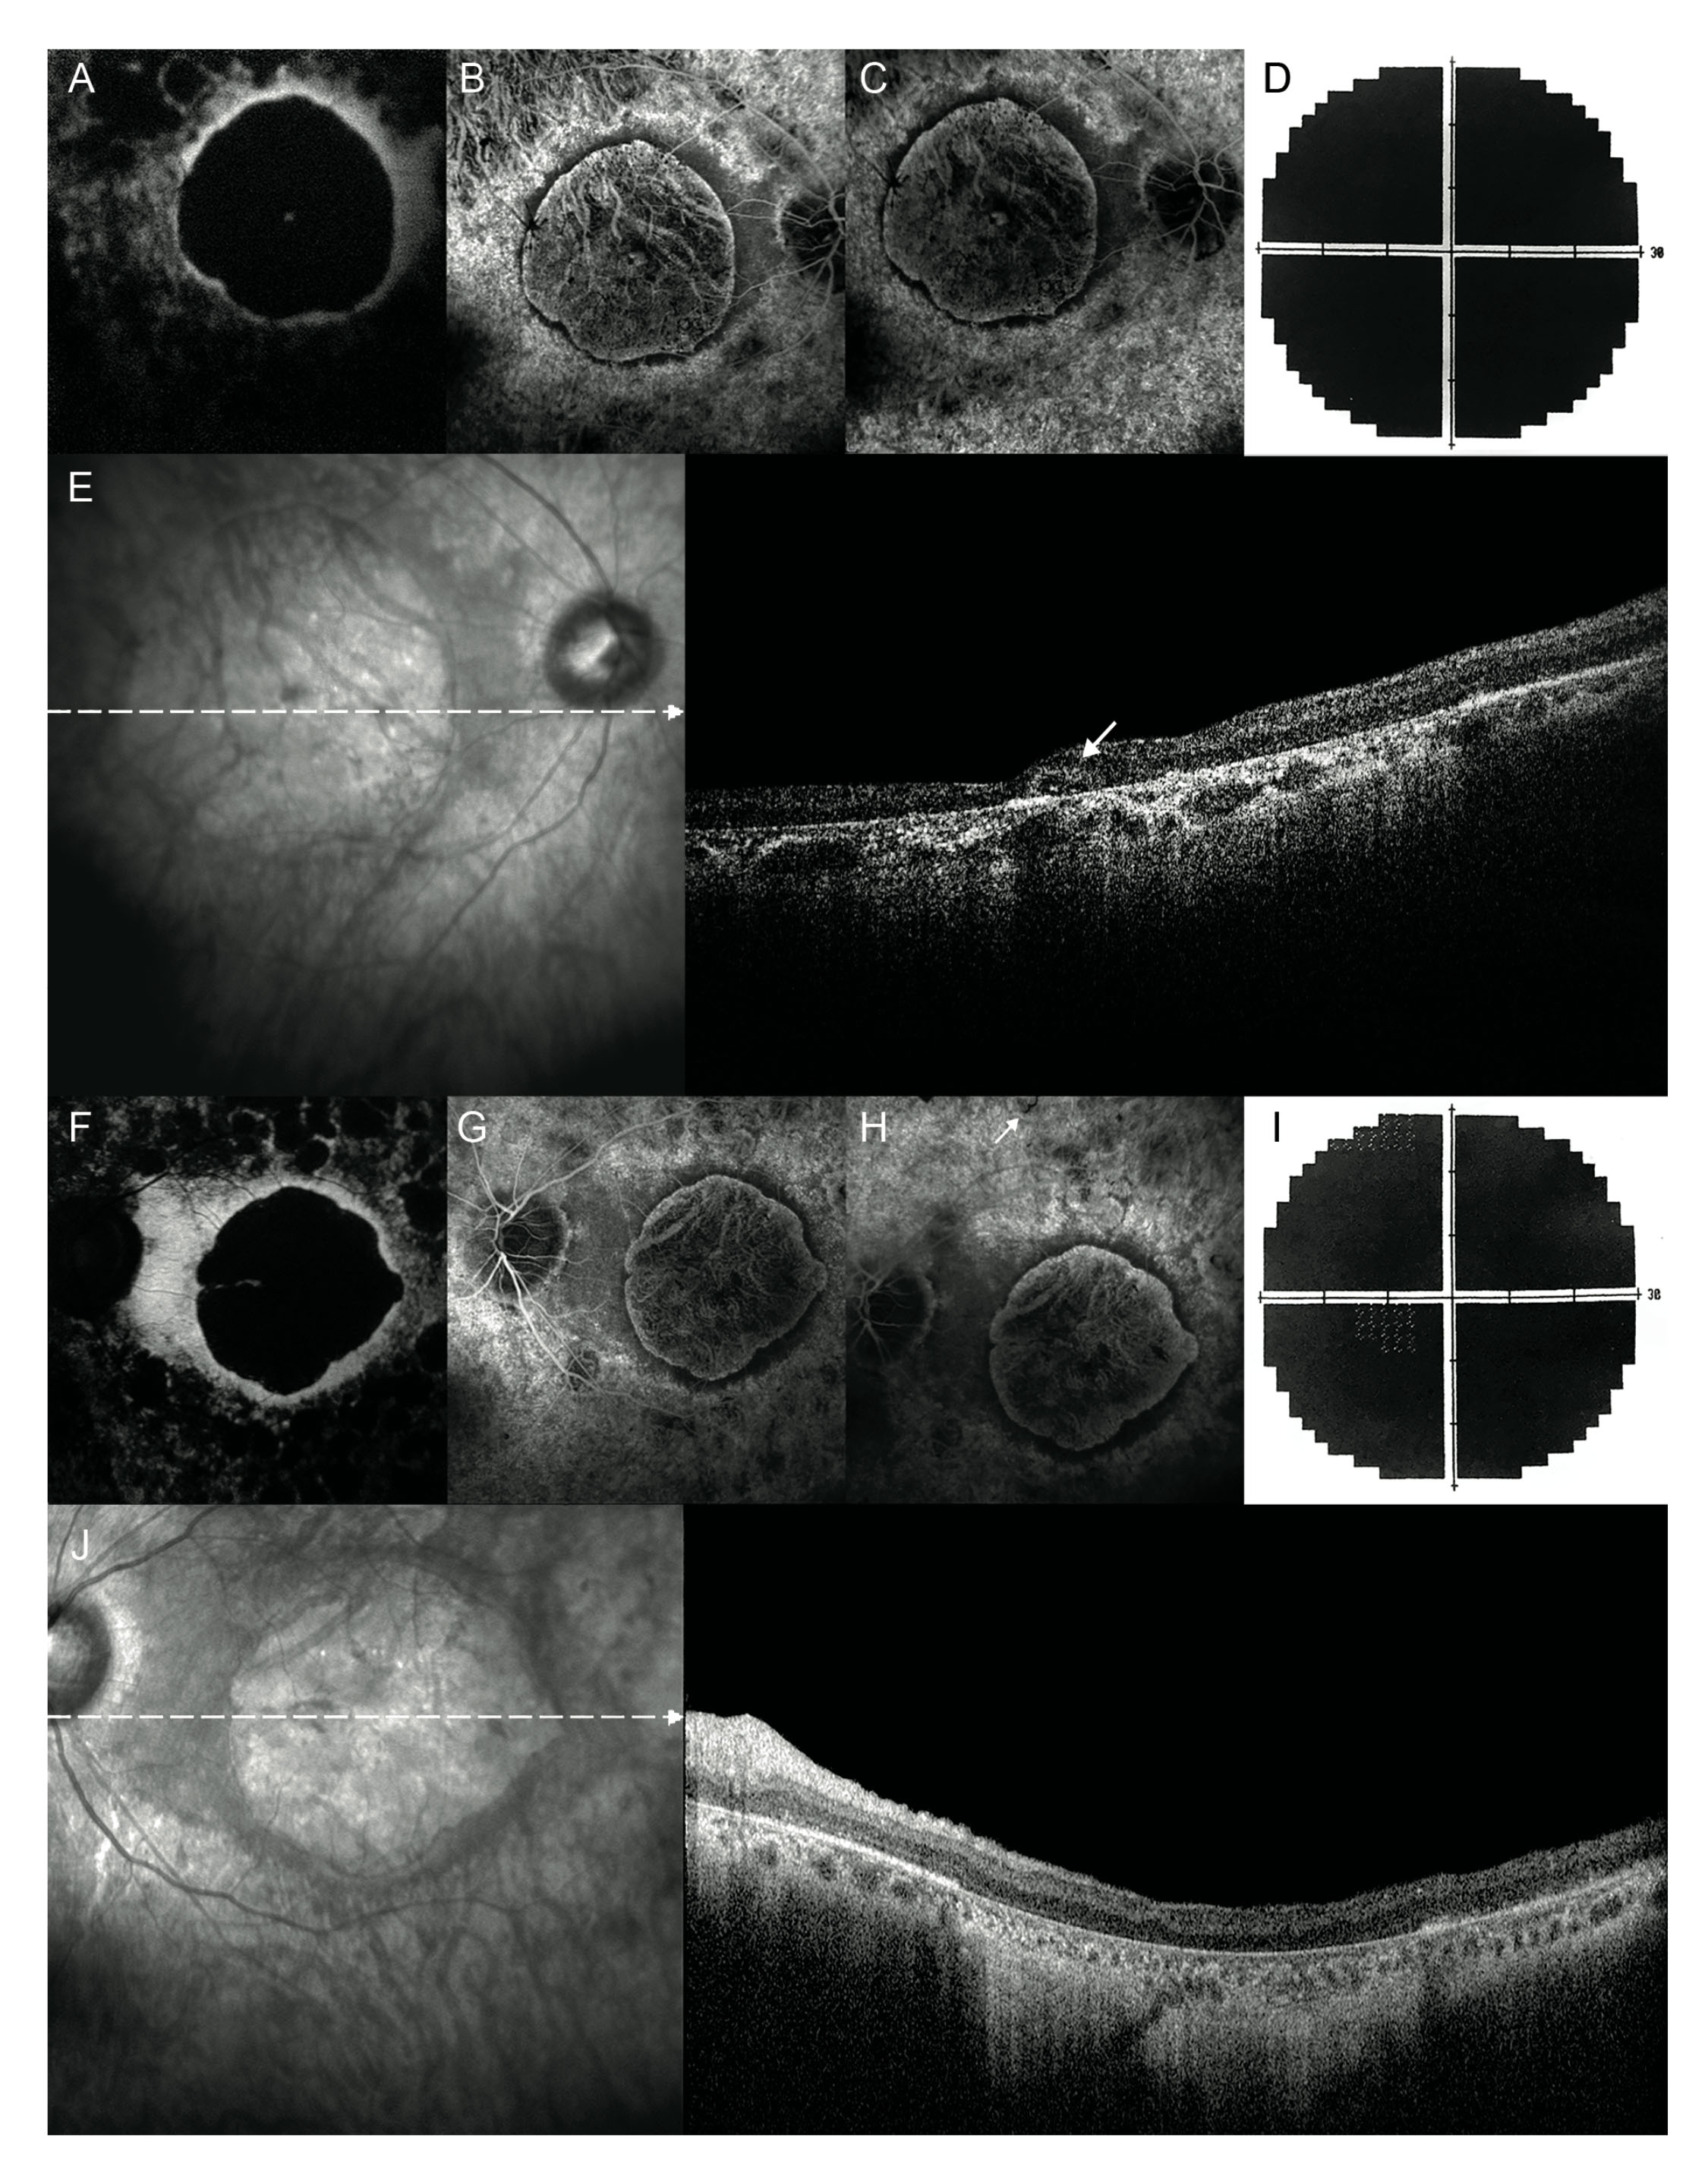
 Figure 3 of
Serra, Mol Vis 2019; 25:814-820.
Figure 3 of
Serra, Mol Vis 2019; 25:814-820.