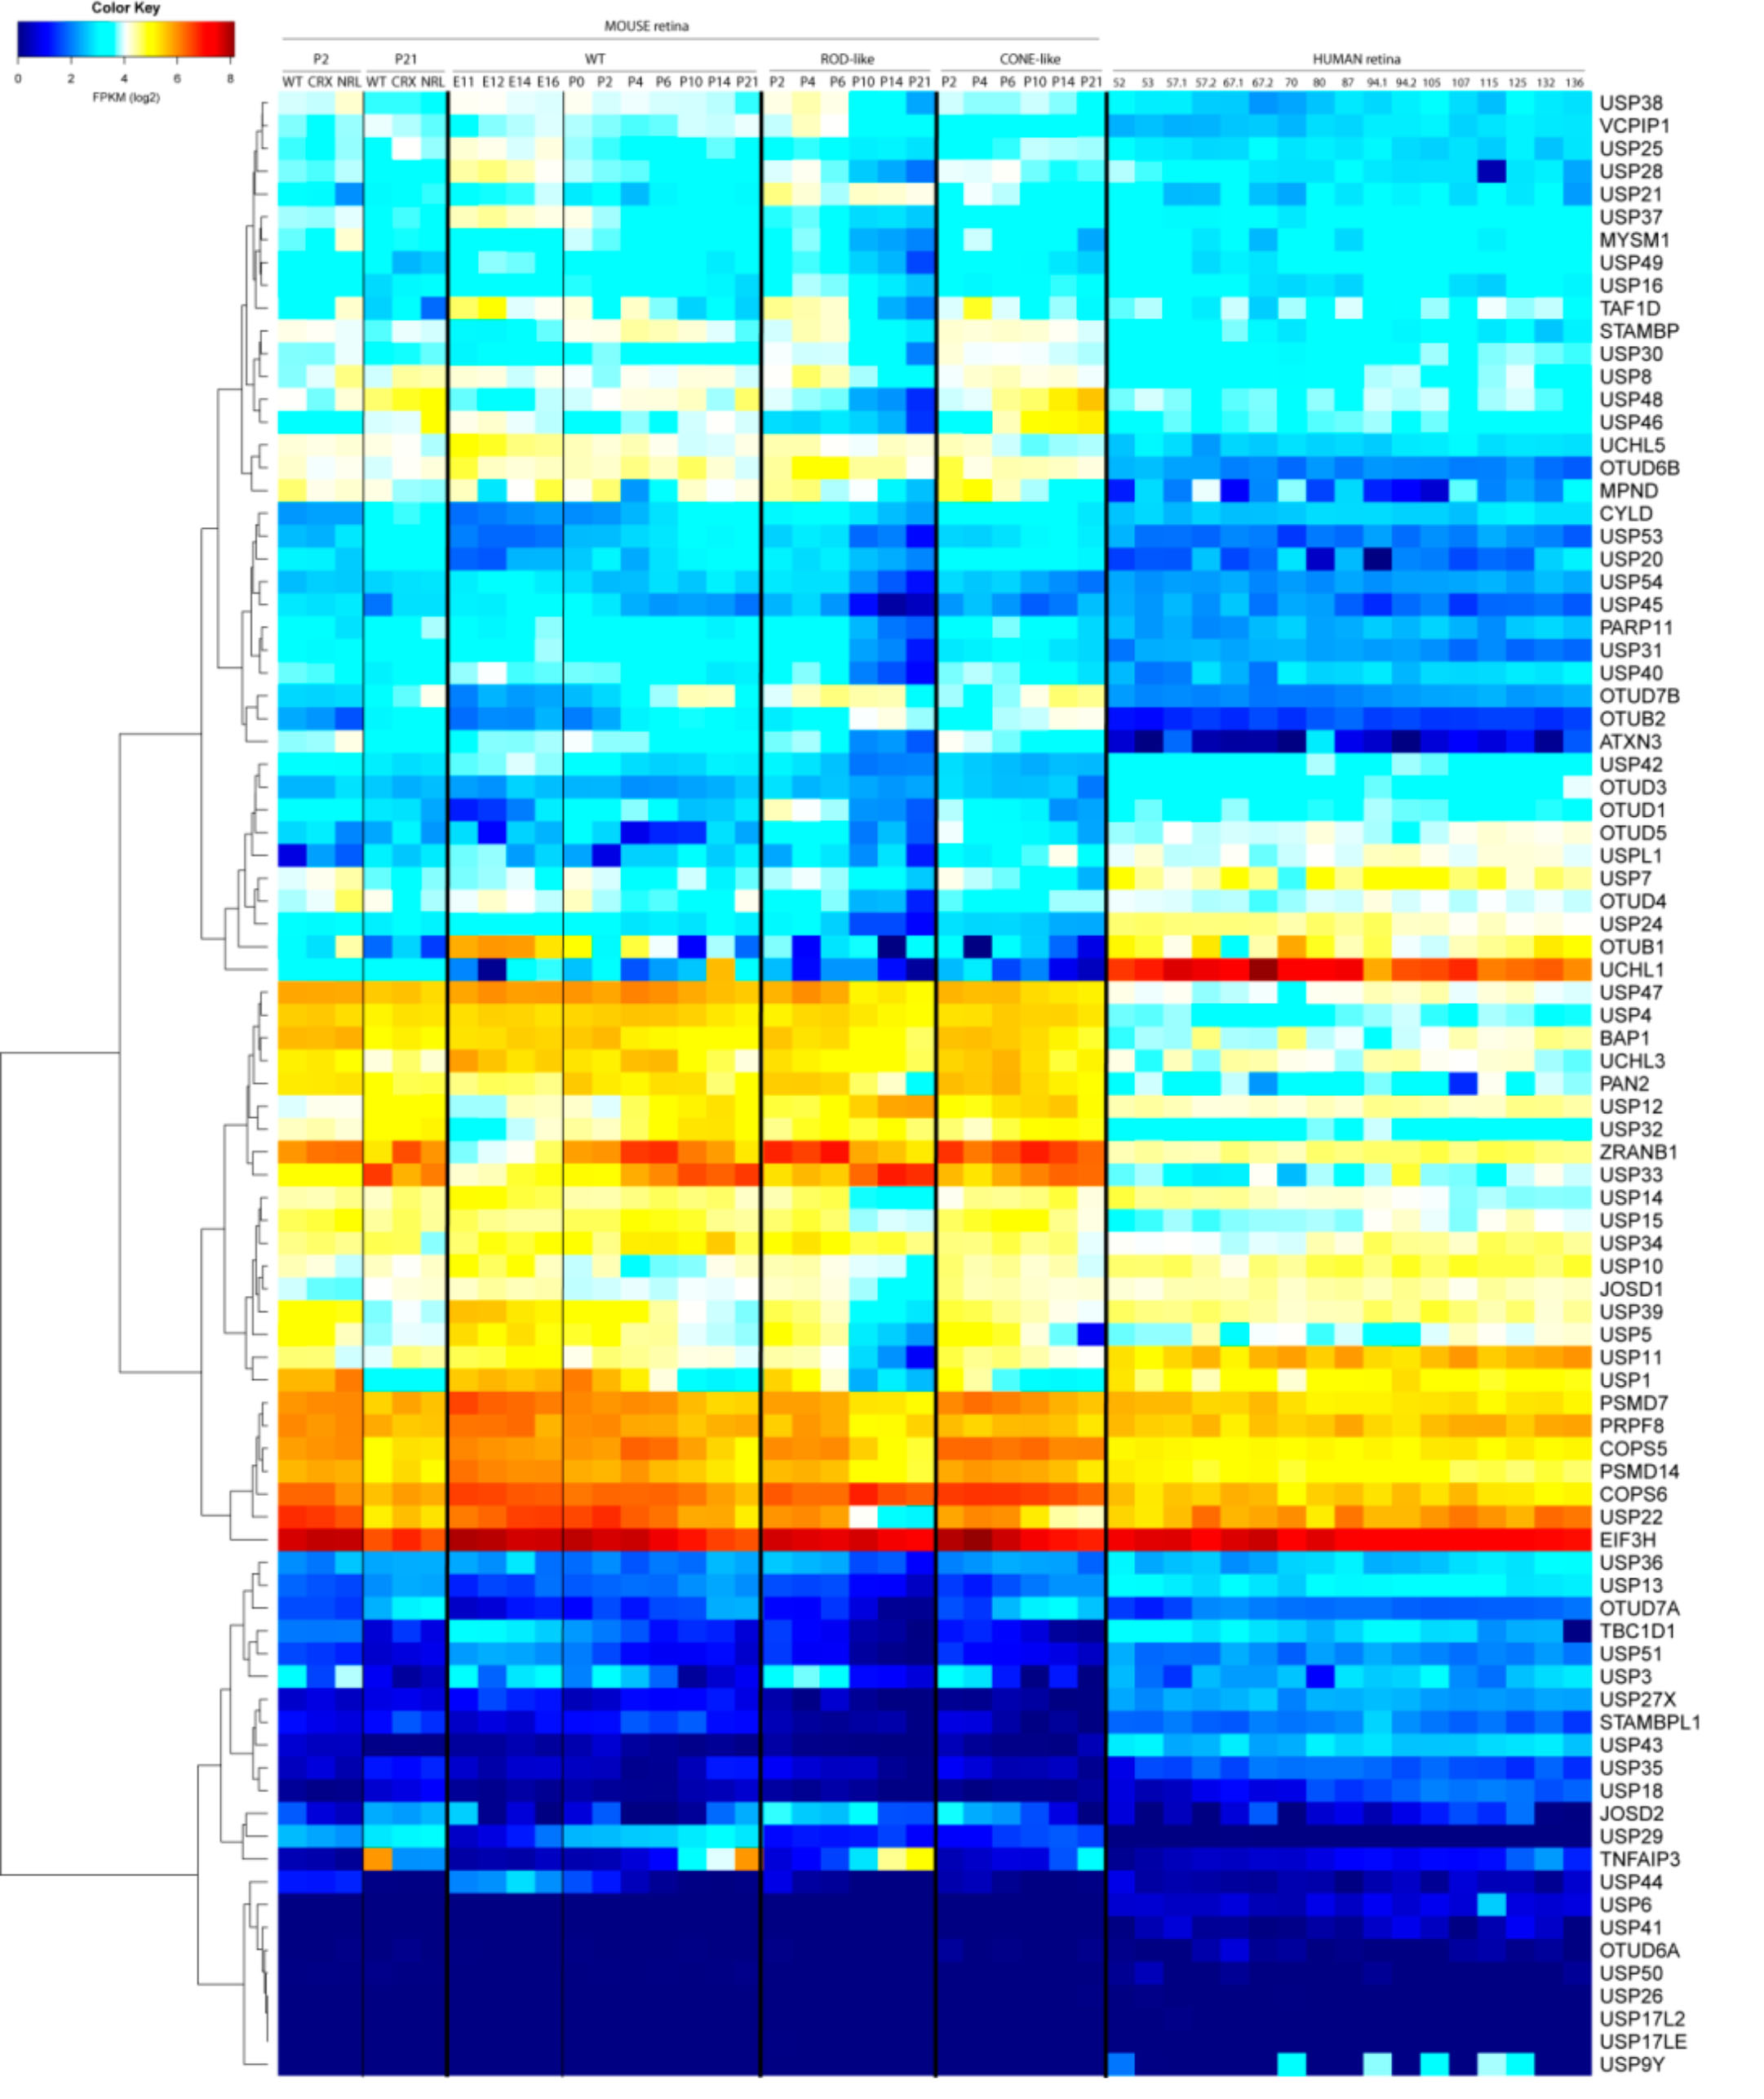
Figure 2. Expression heatmap of deubiquitinating enzyme genes in several human and mouse developmental stages. WT, wild-type mouse retinas;
CRX, mouse Crx knockout (KO) retinas; NRL, mouse Nrl knockout retinas. For the mouse WT retinas, the data shown correspond
to the embryonic 11 (E11), E12, E14, E16, postnatal day 0 (P0), P2, P4, P6, P10, P14, and P21 stages. Rod- and cone-like data
correspond to RNA-sequencing (RNA-seq) from flow-sorted rods and cone-like cells from stages P0, P2, P4, P10, P14, and P21.
For the human retina, the data shown correspond to day 52 postfertilization (D52), D53, D57 (two different samples: D57.1
and D57.2), D67 (two different samples: D67.1 and D67.2), D70, D80, D87, D94 (two different samples: D94.1 and D94.2), D105,
D107, D115, D125, D132, and D136 (details of the RNA-seq libraries and references are in the text). The color key (upper left
corner) indicates the relative expression values. Blue indicates low expression; red, high expression; intermediate expression
is colored in white and light colors (as described in [
10,
31]).
 Figure 2 of
Esquerdo-Barragán, Mol Vis 2019; 25:800-813.
Figure 2 of
Esquerdo-Barragán, Mol Vis 2019; 25:800-813.