Figure 1. MT1 and MT2 form heterodimers in 661W cells. Upper panels: Immunofluorescence for melatonin receptor type 1 (MT1) and MT2 receptors and colocalization. Scale bars = 100 µm. Lower panels: Proximity ligation assay (PLA) showing the MT1/MT2 interaction (positive signal shown as red dots in the right panel). Cell nuclei are shown in green. Scale bars: left and
center = 100 µm, right = 50 µm.
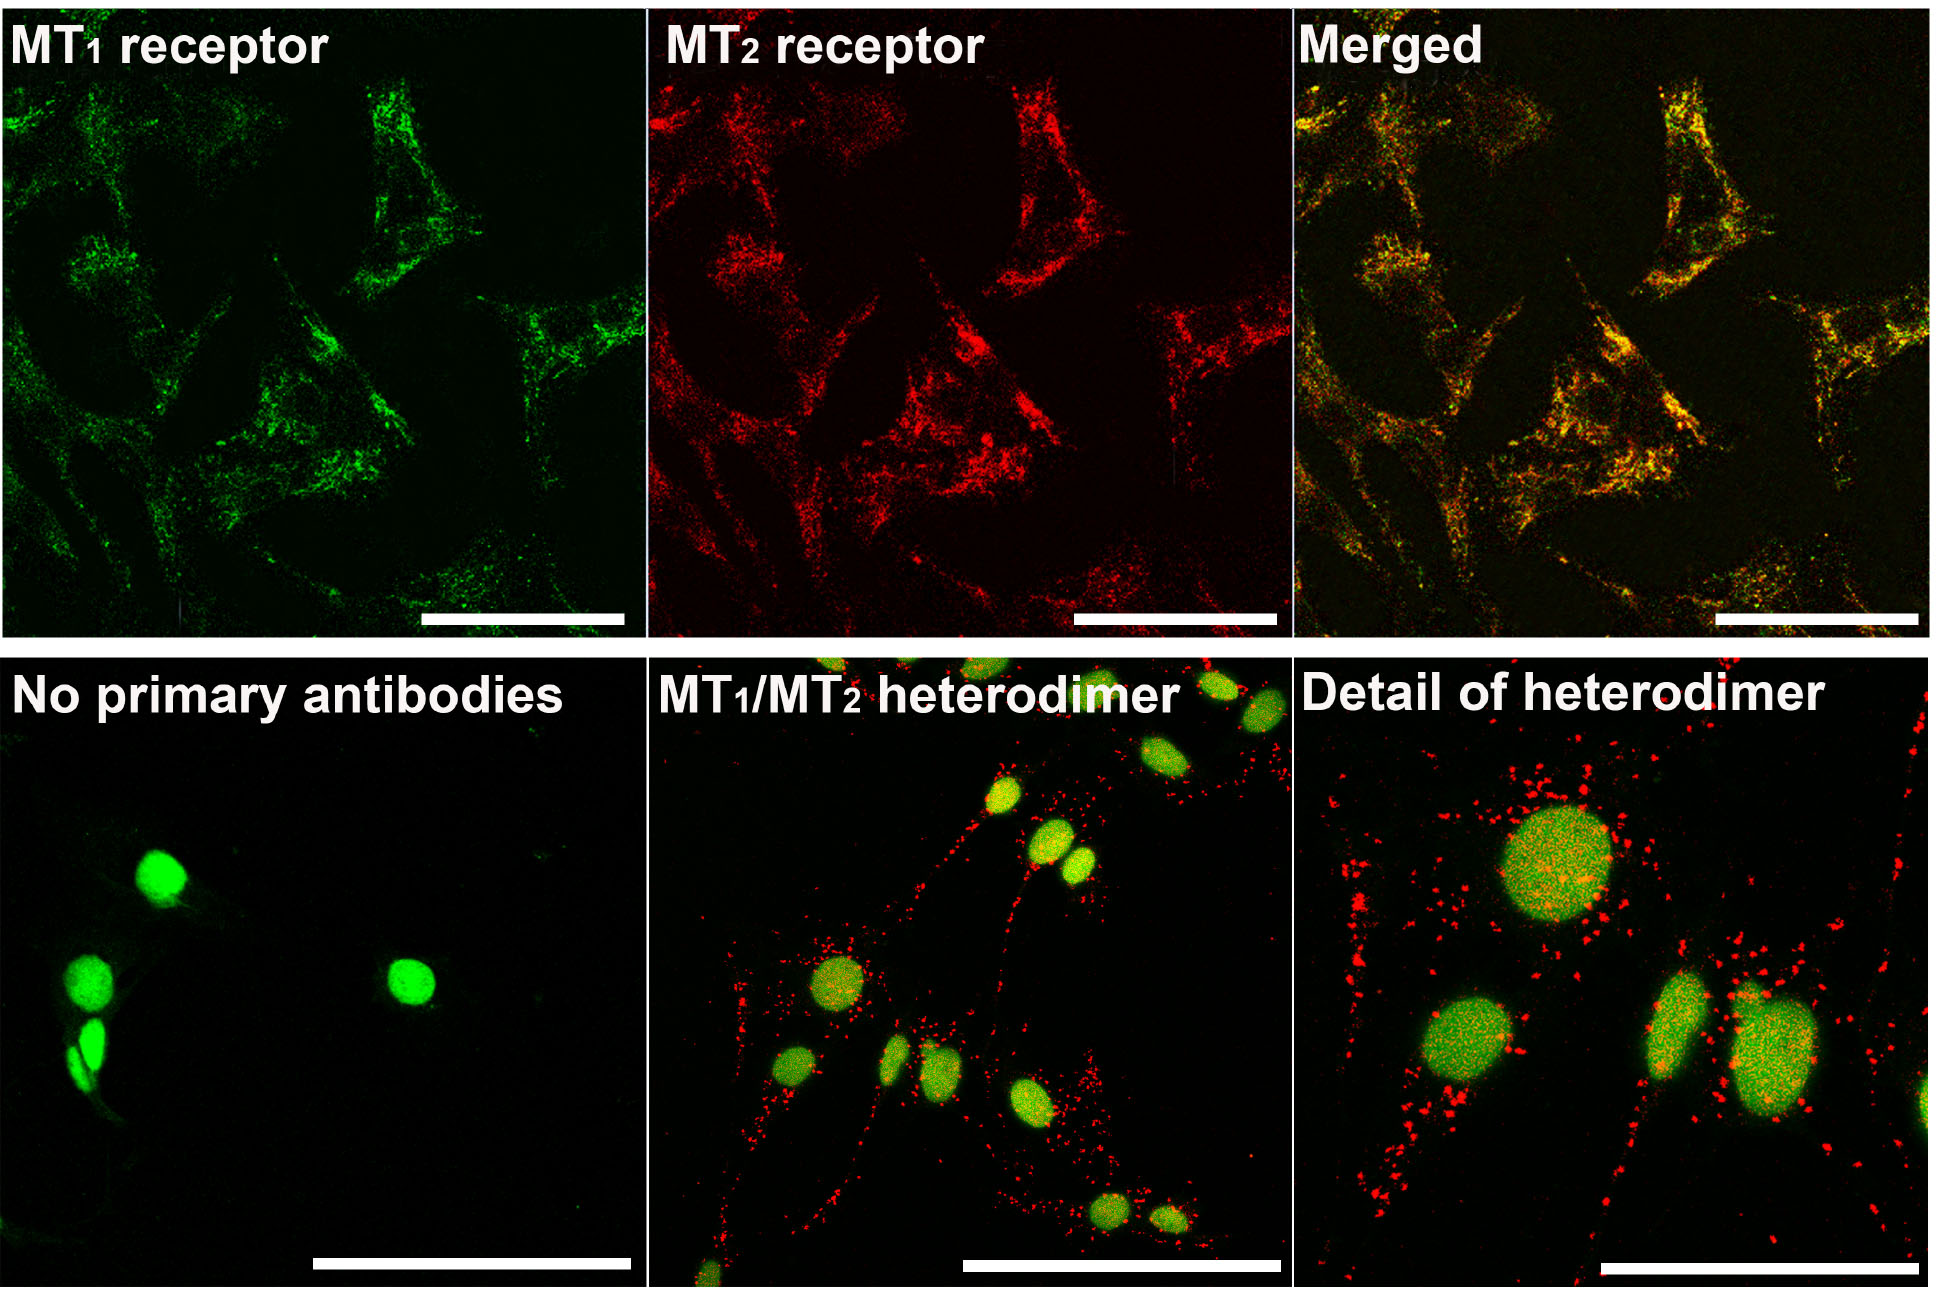
 Figure 1 of
Sánchez-Bretaño, Mol Vis 2019; 25:791-799.
Figure 1 of
Sánchez-Bretaño, Mol Vis 2019; 25:791-799.