Figure 2. Association between advanced AMD and common SNPs in EURs and AFRs. A forest plot of the univariate association between advanced
AMD and common SNPs in A: EURs and B: AFRs. The table describes the SNP being considered, the model type, the estimated OR for AMD, and the associated p value.
The plot shows the estimated OR with 95% CIs for the respective SNP and model. The gray vertical line represents the null
OR of 1. Recessive SNP models missing values in the table and on the plot indicate that there were fewer than three subjects
in the study population with two copies of the minor allele for that SNP. Additive models with missing values indicate that
no subjects were recessive for the minor allele.
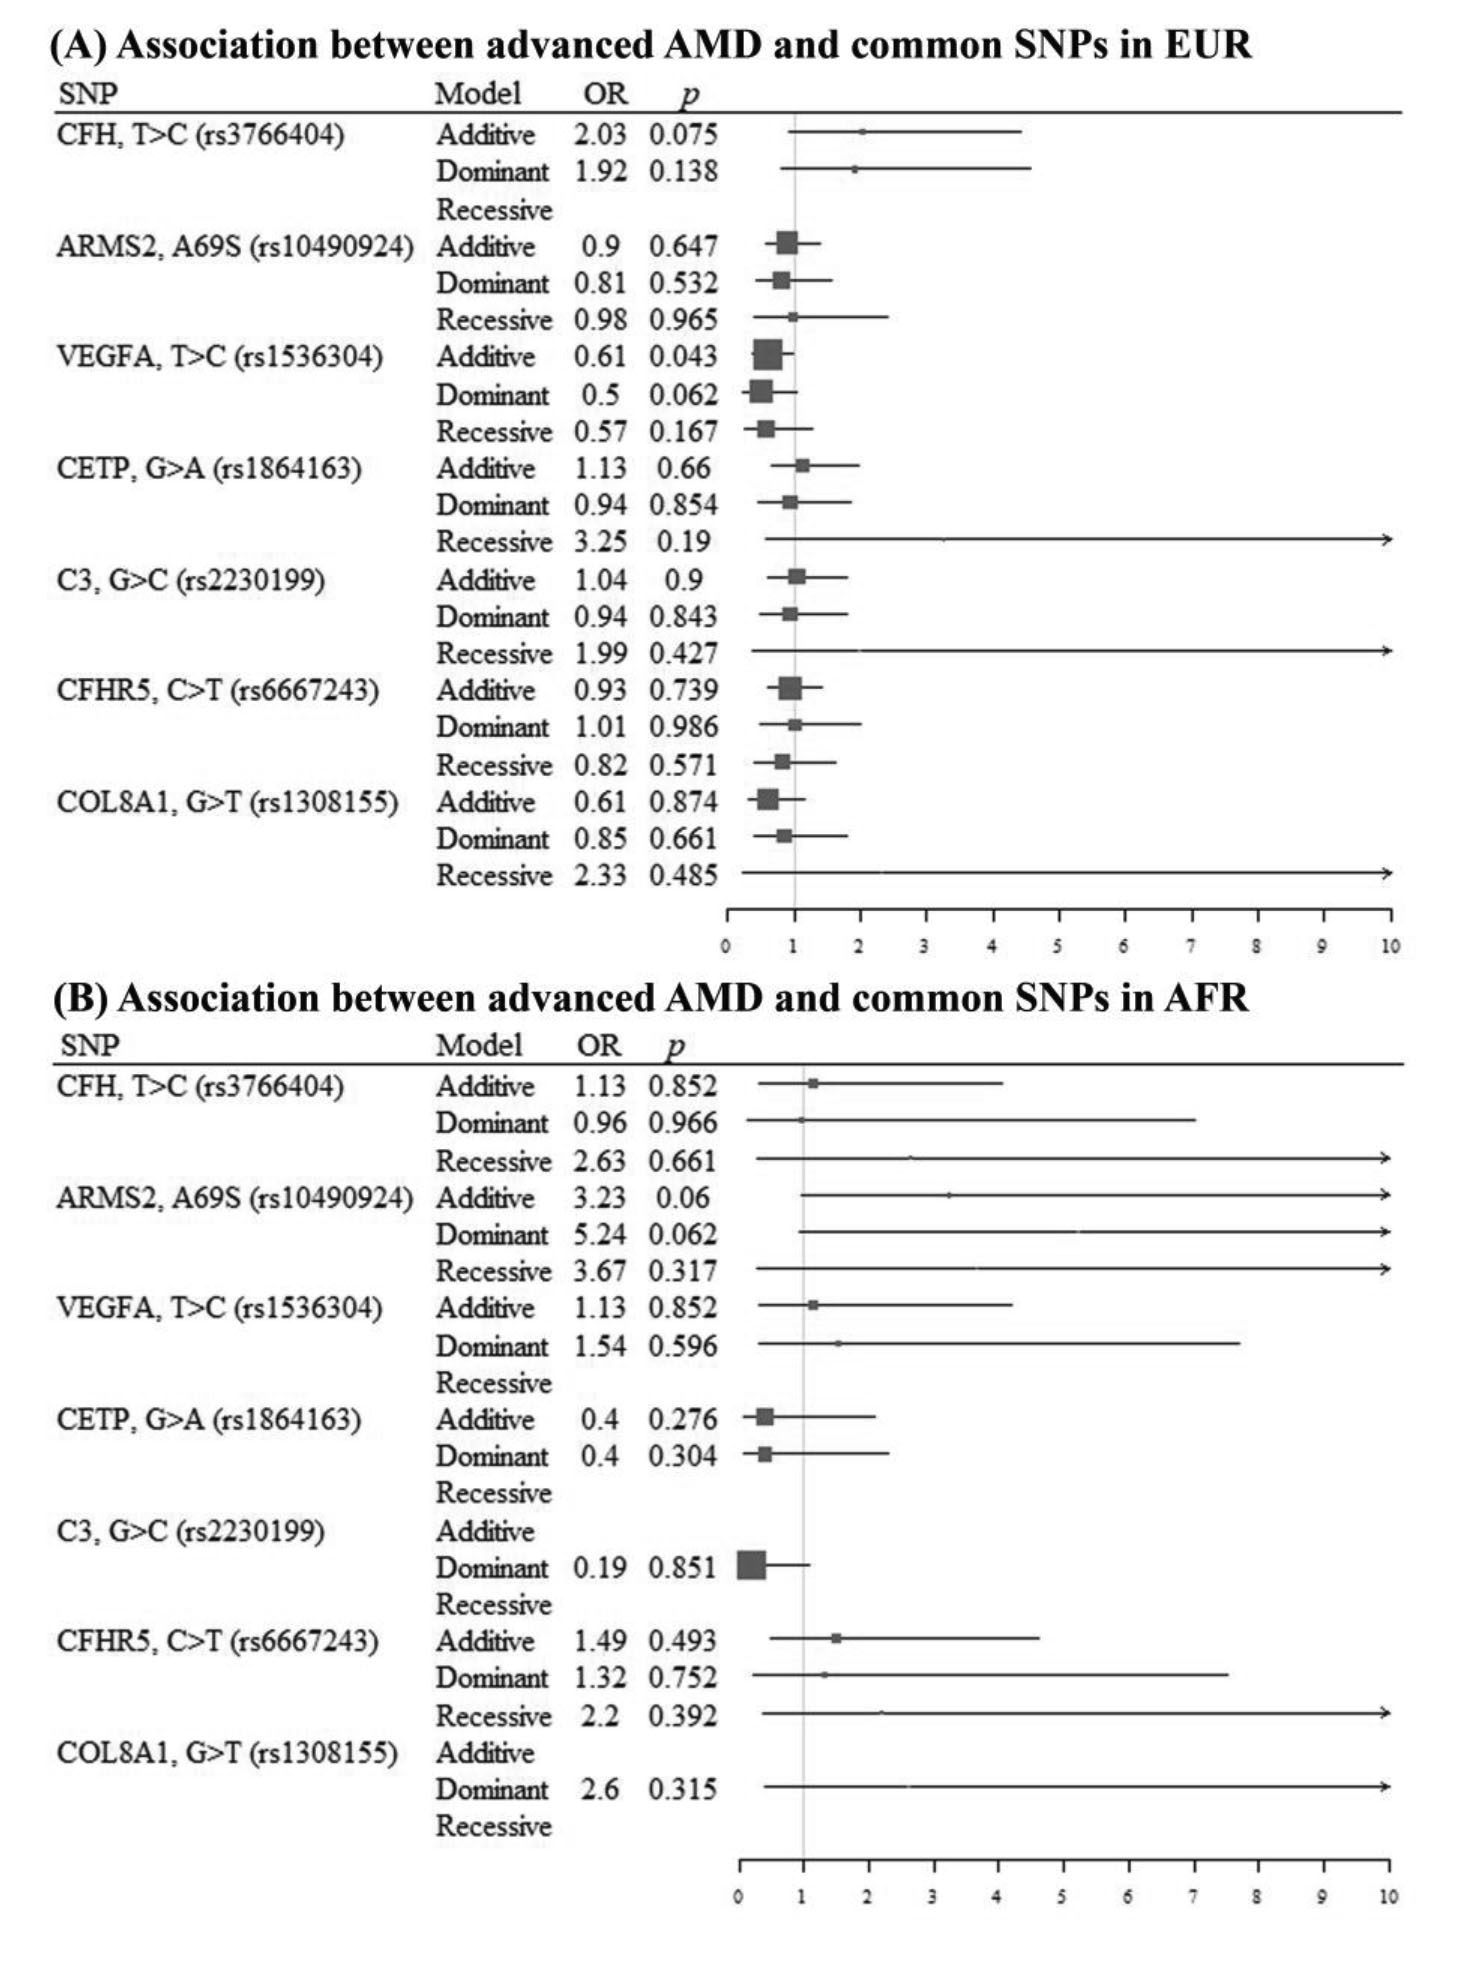
 Figure 2 of
Rohrer, Mol Vis 2019; 25:79-92.
Figure 2 of
Rohrer, Mol Vis 2019; 25:79-92.