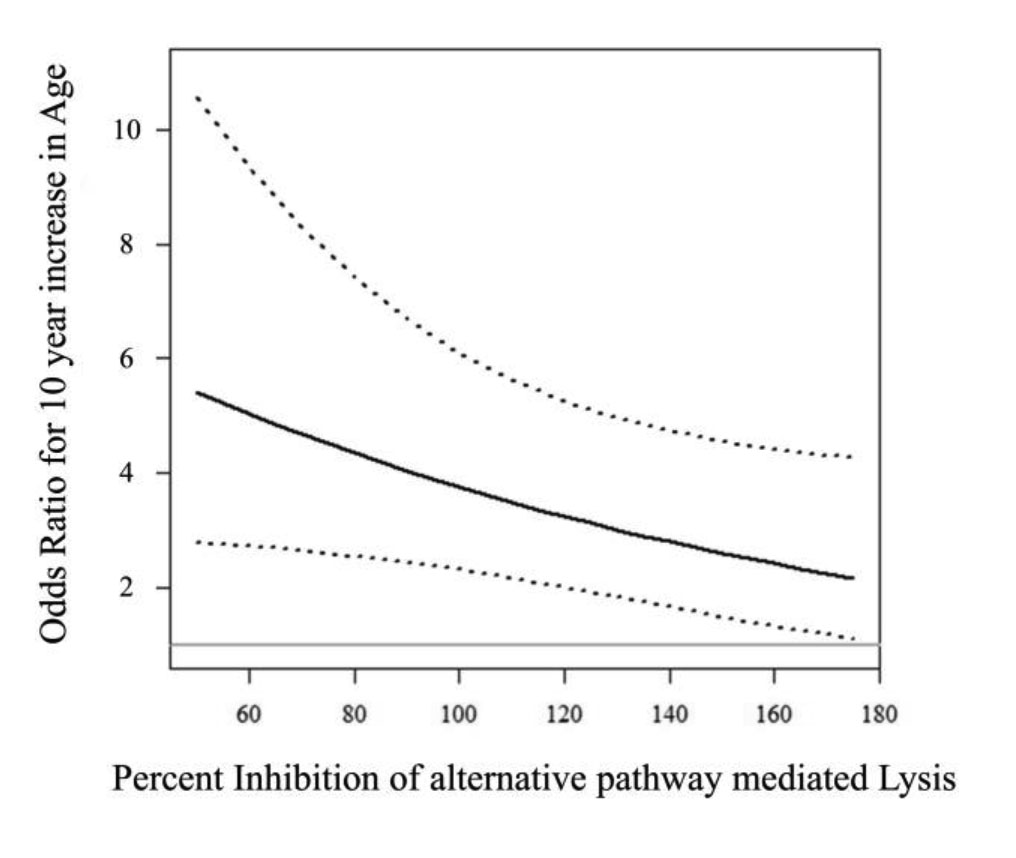
Figure 1. Plot of the OR for a ten-year increase in age with increasing levels of the inhibition of alternative pathway-mediated lysis
by factor H. Percent inhibition of lysis has been normalized to 100 as described in the methods. The solid line is the OR
from the multiple logistic regression model of AMD presented in
Table 3. The dashed lines represent the 95% confidence interval for the OR at specific values of the inhibition of lysis. The solid
gray line represents the null OR of 1. Values of the inhibition of lysis range from 50 to 175, which are the 10th and 90th
percentiles of observed values in our study population. The plot indicates that as the inhibition of lysis increases, the
impact of increasing age on the probability of developing AMD decreases.
 Figure 1 of
Rohrer, Mol Vis 2019; 25:79-92.
Figure 1 of
Rohrer, Mol Vis 2019; 25:79-92.