Figure 1. Segregation analysis of the families carrying any one of five likely pathogenic variants. The five variants are JV1, c.4957dupA
(p.(Ser1653Lysfs*2)) ; JV2, c.8868C>A (p.(Tyr2956*)); JV3, c.2528G>A (p.(Gly843Glu)); JV4, c.6557G>A (p.(Gly2186Glu)); and
JV5, c.6563T>C (p.(Ile2188Thr)). A: Families carrying homozygous JV1, JV2, or JV3. B: Families carrying compound heterozygous JV3. C: Families carrying JV4. D: Families carrying JV5. A filled symbol indicates an affected individual. An arrow indicates a proband in the family. Genotype
was represented as follows: For example, JV1/JV1 indicates homozygous variants c.[4957dupA];[4957dupA]; JV1/+ indicates a
single heterozygous variant c.[4957dupA];[4957=]; JV1/JV2 indicates compound heterozygous variants c.[4957dupA];[8868C>A];
+/+ indicates wild-type alleles. The probable genotype of a deceased individual is shown in parentheses.
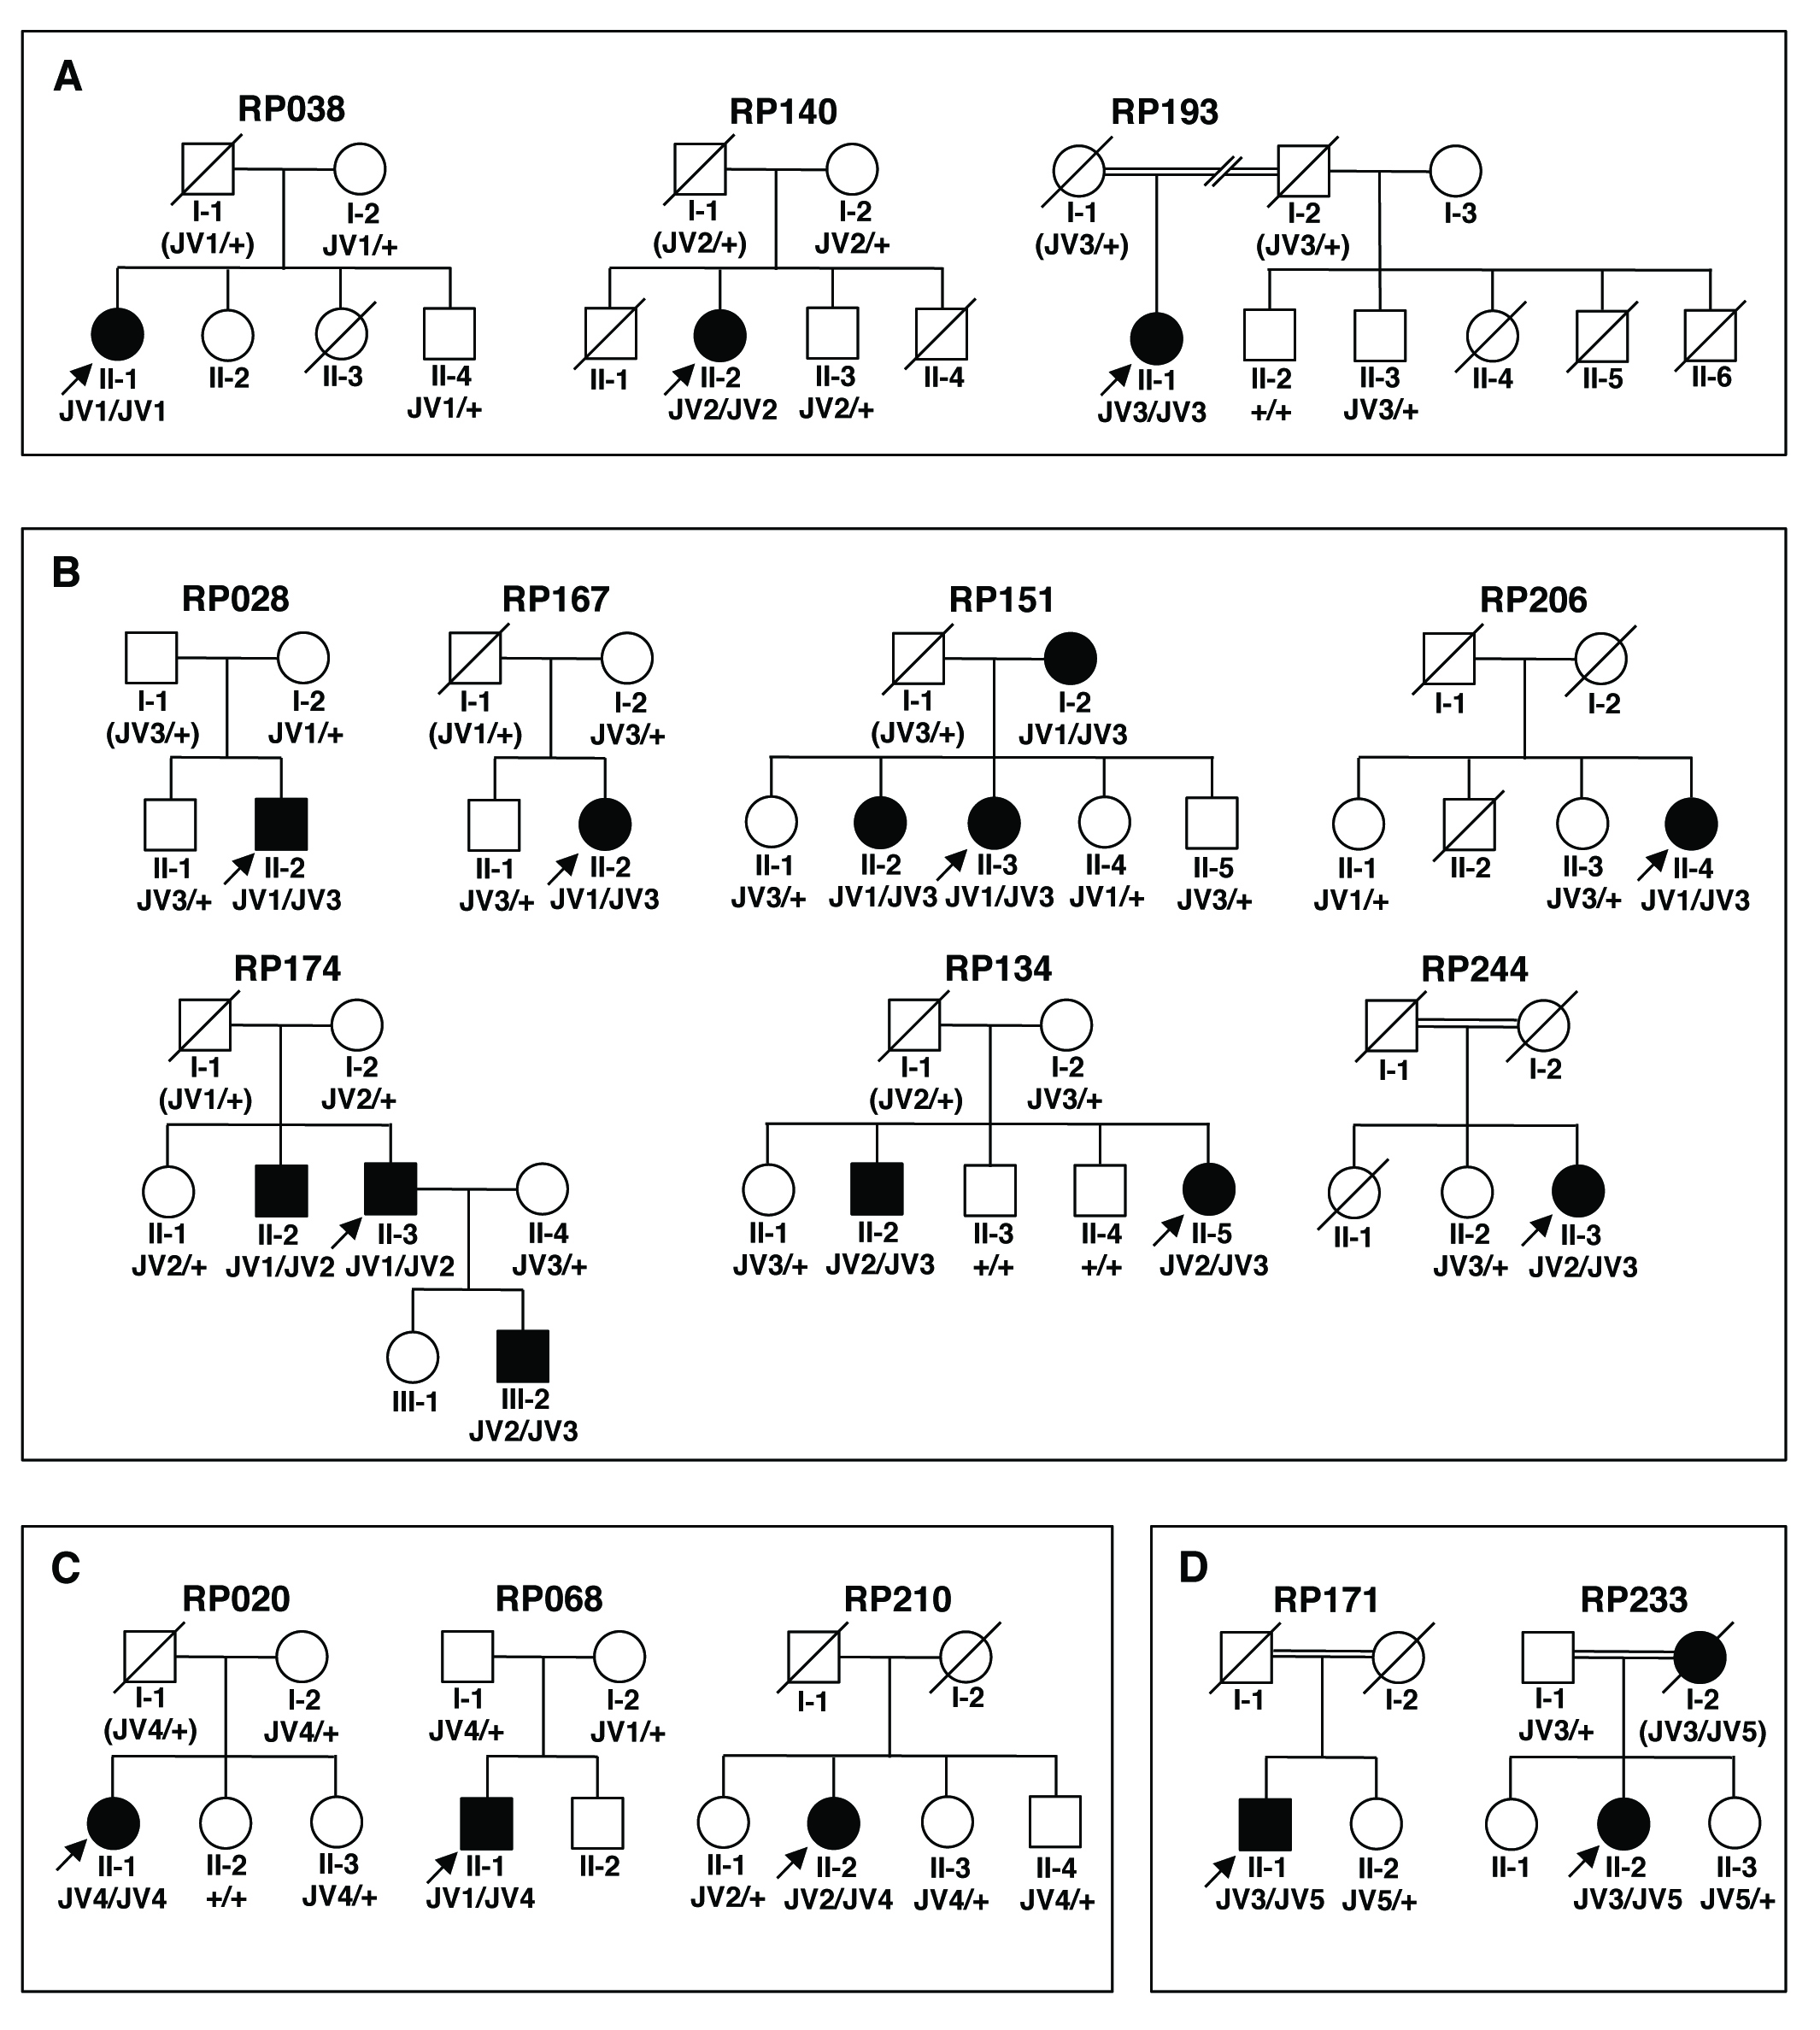
 Figure 1 of
Iwanami, Mol Vis 2019; 25:766-779.
Figure 1 of
Iwanami, Mol Vis 2019; 25:766-779.