Figure 2 of
Zeng, Mol Vis 2019; 25:756-765.
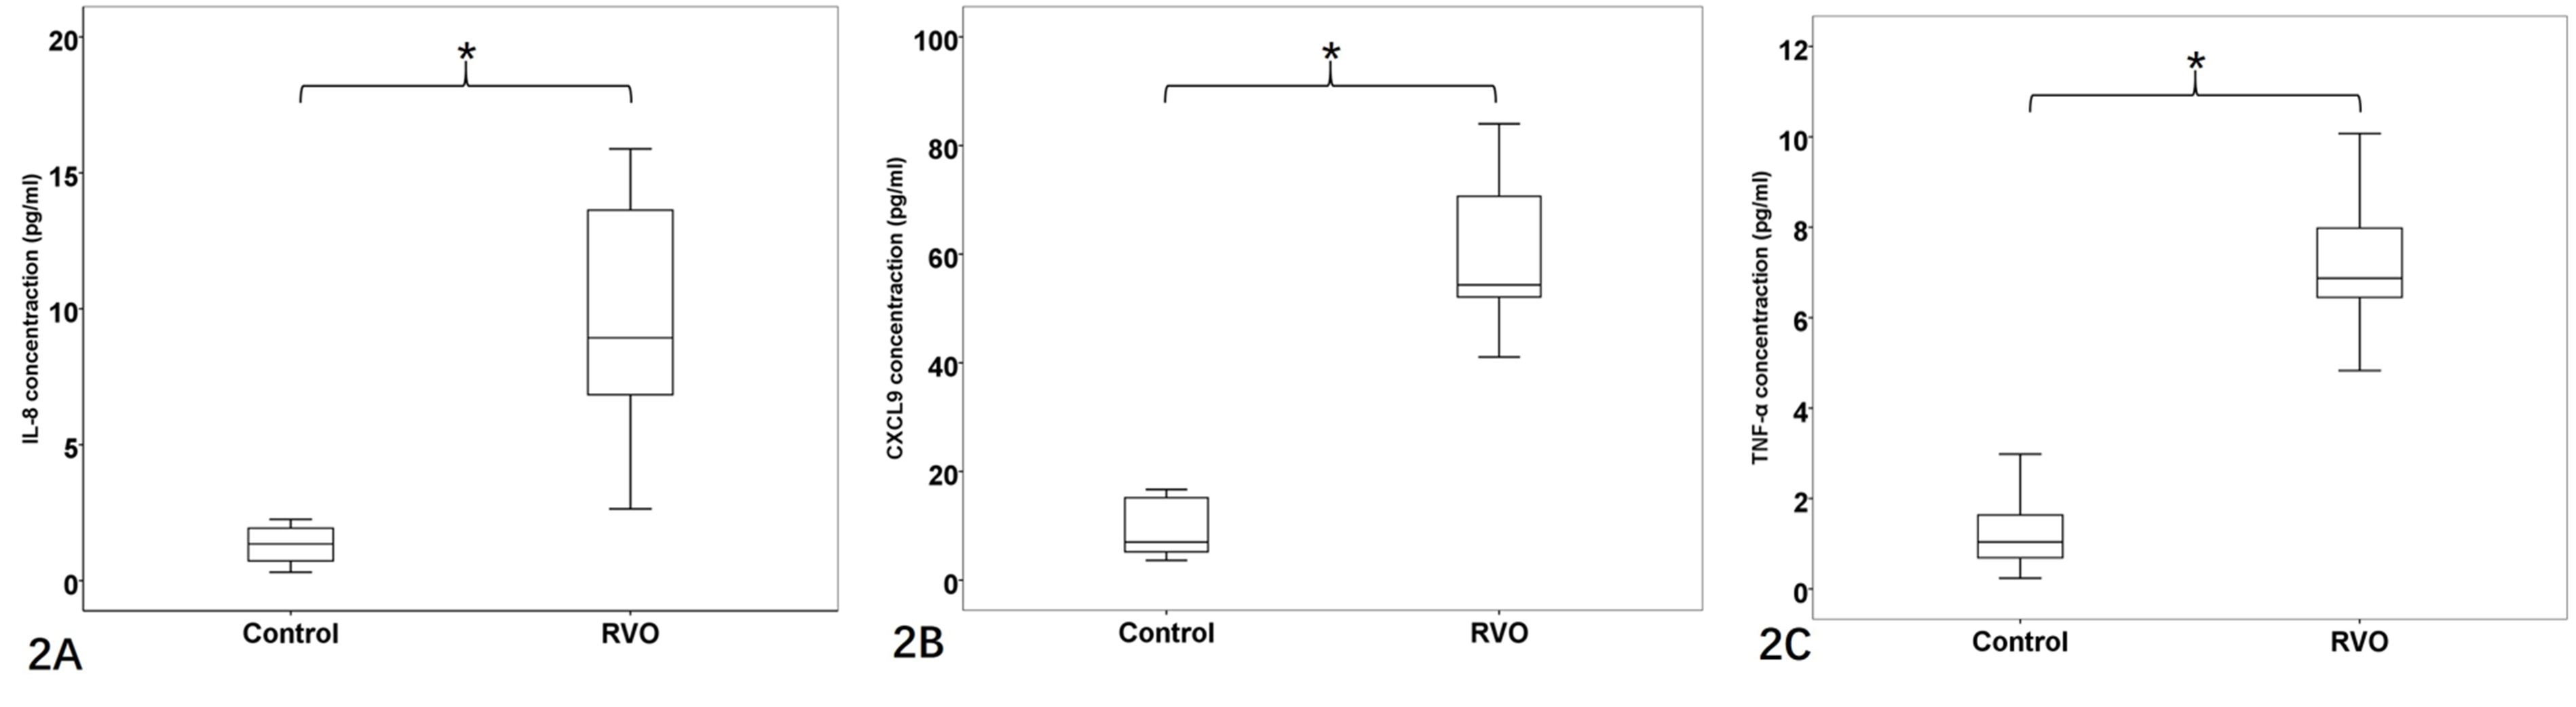
Figure 2.
Box plots of chemokines in the RVO group (n=25) and control group (n=20).
A
: IL-8,
B
: CXCL9 and
C
: TNF-α. *=Statistically significant (Mann-Whitney U test, all p<0.001).
 Figure 2 of
Zeng, Mol Vis 2019; 25:756-765.
Figure 2 of
Zeng, Mol Vis 2019; 25:756-765.