Figure 4. Comparison of protein and transcript expression. A: TJP1 / ZO-1 specific surface marker. 20X, immunostaining on flat-mounted cornea, corneal endothelium, basal condition respectively.
B: 40X, immunocytochemistry of second passage cultured CECs upon a two-phase culture system. Specific surface markers were
assessed upon a two-phase culture system. In RestM, tight junction zig-zag characteristic configuration is observed and well
stablished between cells. In MitoM, weak fluorescent signal and lack of protein location. In control no primary antibody;
exposure normalized for each antibody set. C: qPCR of markers in rabbit CECs (basal expression levels), MitoM condition or RestM condition. Ct values were normalized
using GAPDH. ΔCT represent the difference in Ct values between GAPDH and the gene shown.
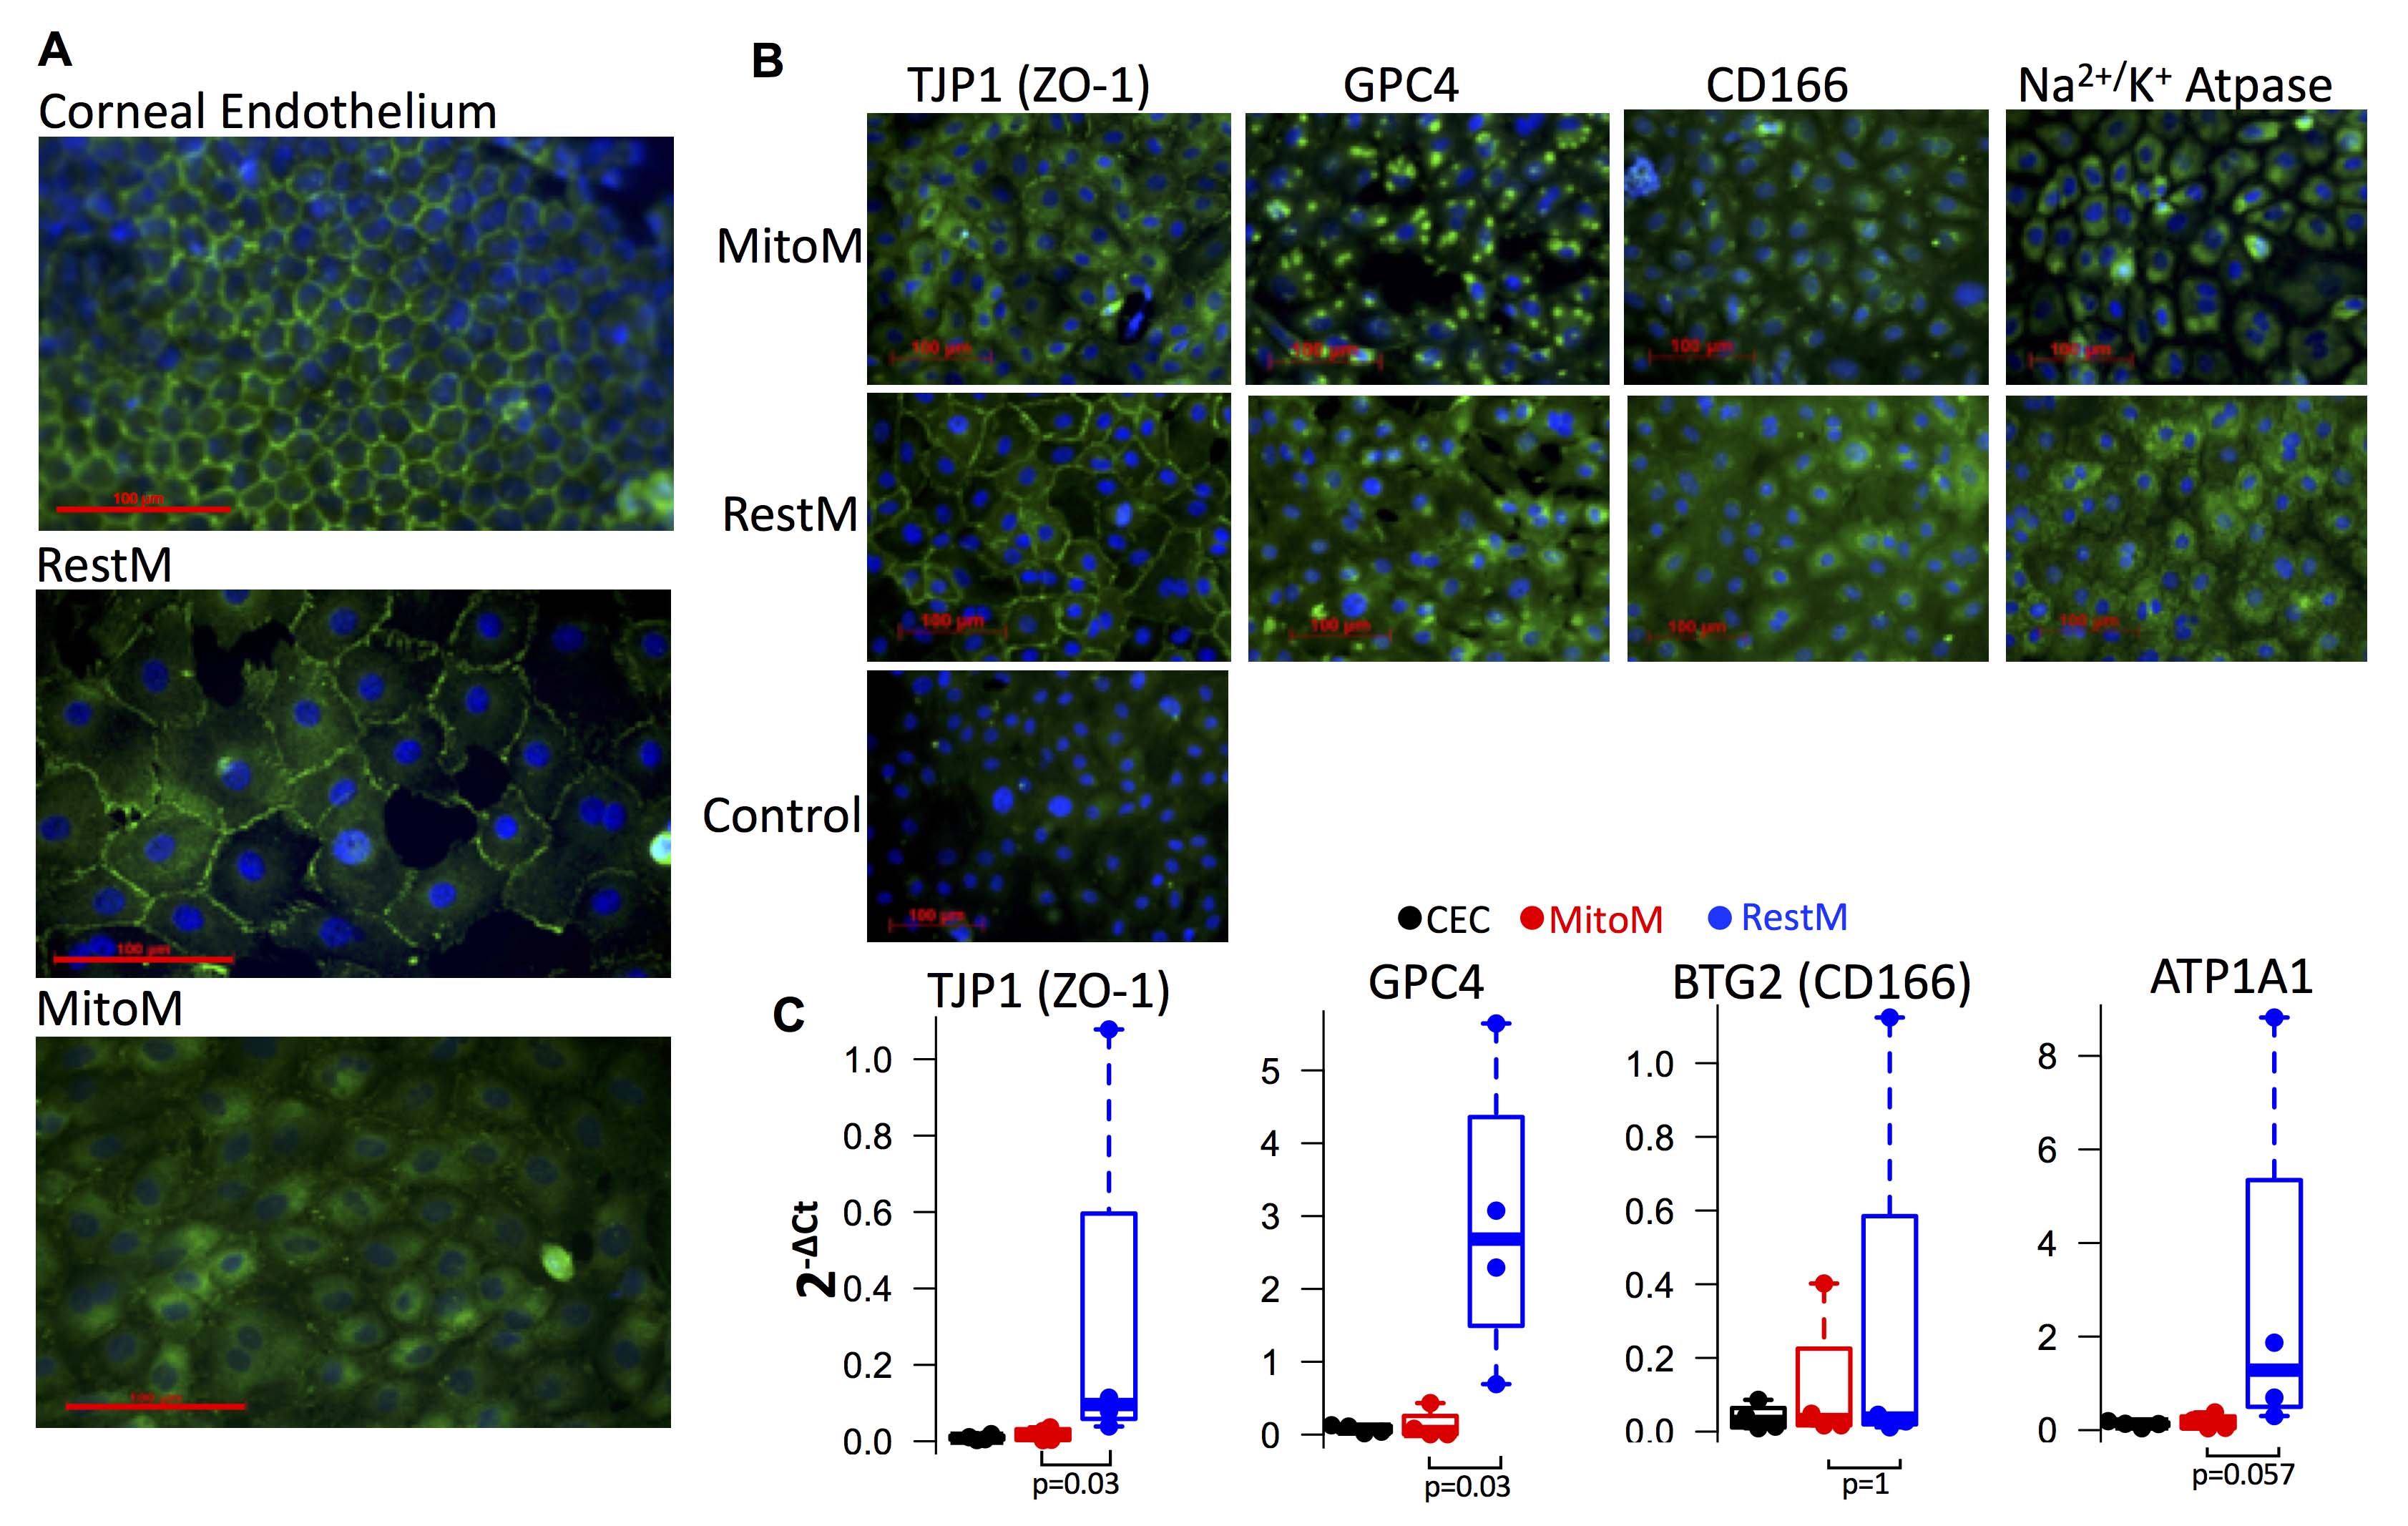
 Figure 4 of
Rodríguez-Barrientos, Mol Vis 2019; 25:745-xxx.
Figure 4 of
Rodríguez-Barrientos, Mol Vis 2019; 25:745-xxx.