Figure 3. Gene expression comparison and functional analysis. A: Differential expressed corneal endothelial cell (CEC) markers between cells cultured in RestM and MitoM. The molecular markers
are grouped by type. Only markers close to p=0.05 are shown. Relative expression is estimated in the Z-score (standard deviations
from the mean). B: Functional analysis of differentially expressed genes. The heat map shows the genes (horizontal axis) contained within functional
biological terms (vertical axis). The color represents the fold change in gene expression (cyan is used to represent those
genes that were more greatly expressed in MitoM, while purple represents those genes more greatly expressed in RestM). Genes
whose t test p values were less than 0.01, and which demonstrated a fold change greater than 1, were used. Only over-represented
biological terms with a p value of less than 0.01, a false discovery rate of less than 0.25, and those that contained more
than three genes were used in this analysis. Details of this figure, including the genes and biological terms used, are provided
in the Appendix 1 and Appendix 2. C: The relative expression of selected functional terms. The color represents the fold change in gene expression (cyan is used
to represent those genes that are more expressed in MitoM, while purple is used for those genes more greatly expressed in
RestM). Genes with a t test p value less than 0.01 and a fold change greater than 1 were used. The dashed lines mark twofold expression.
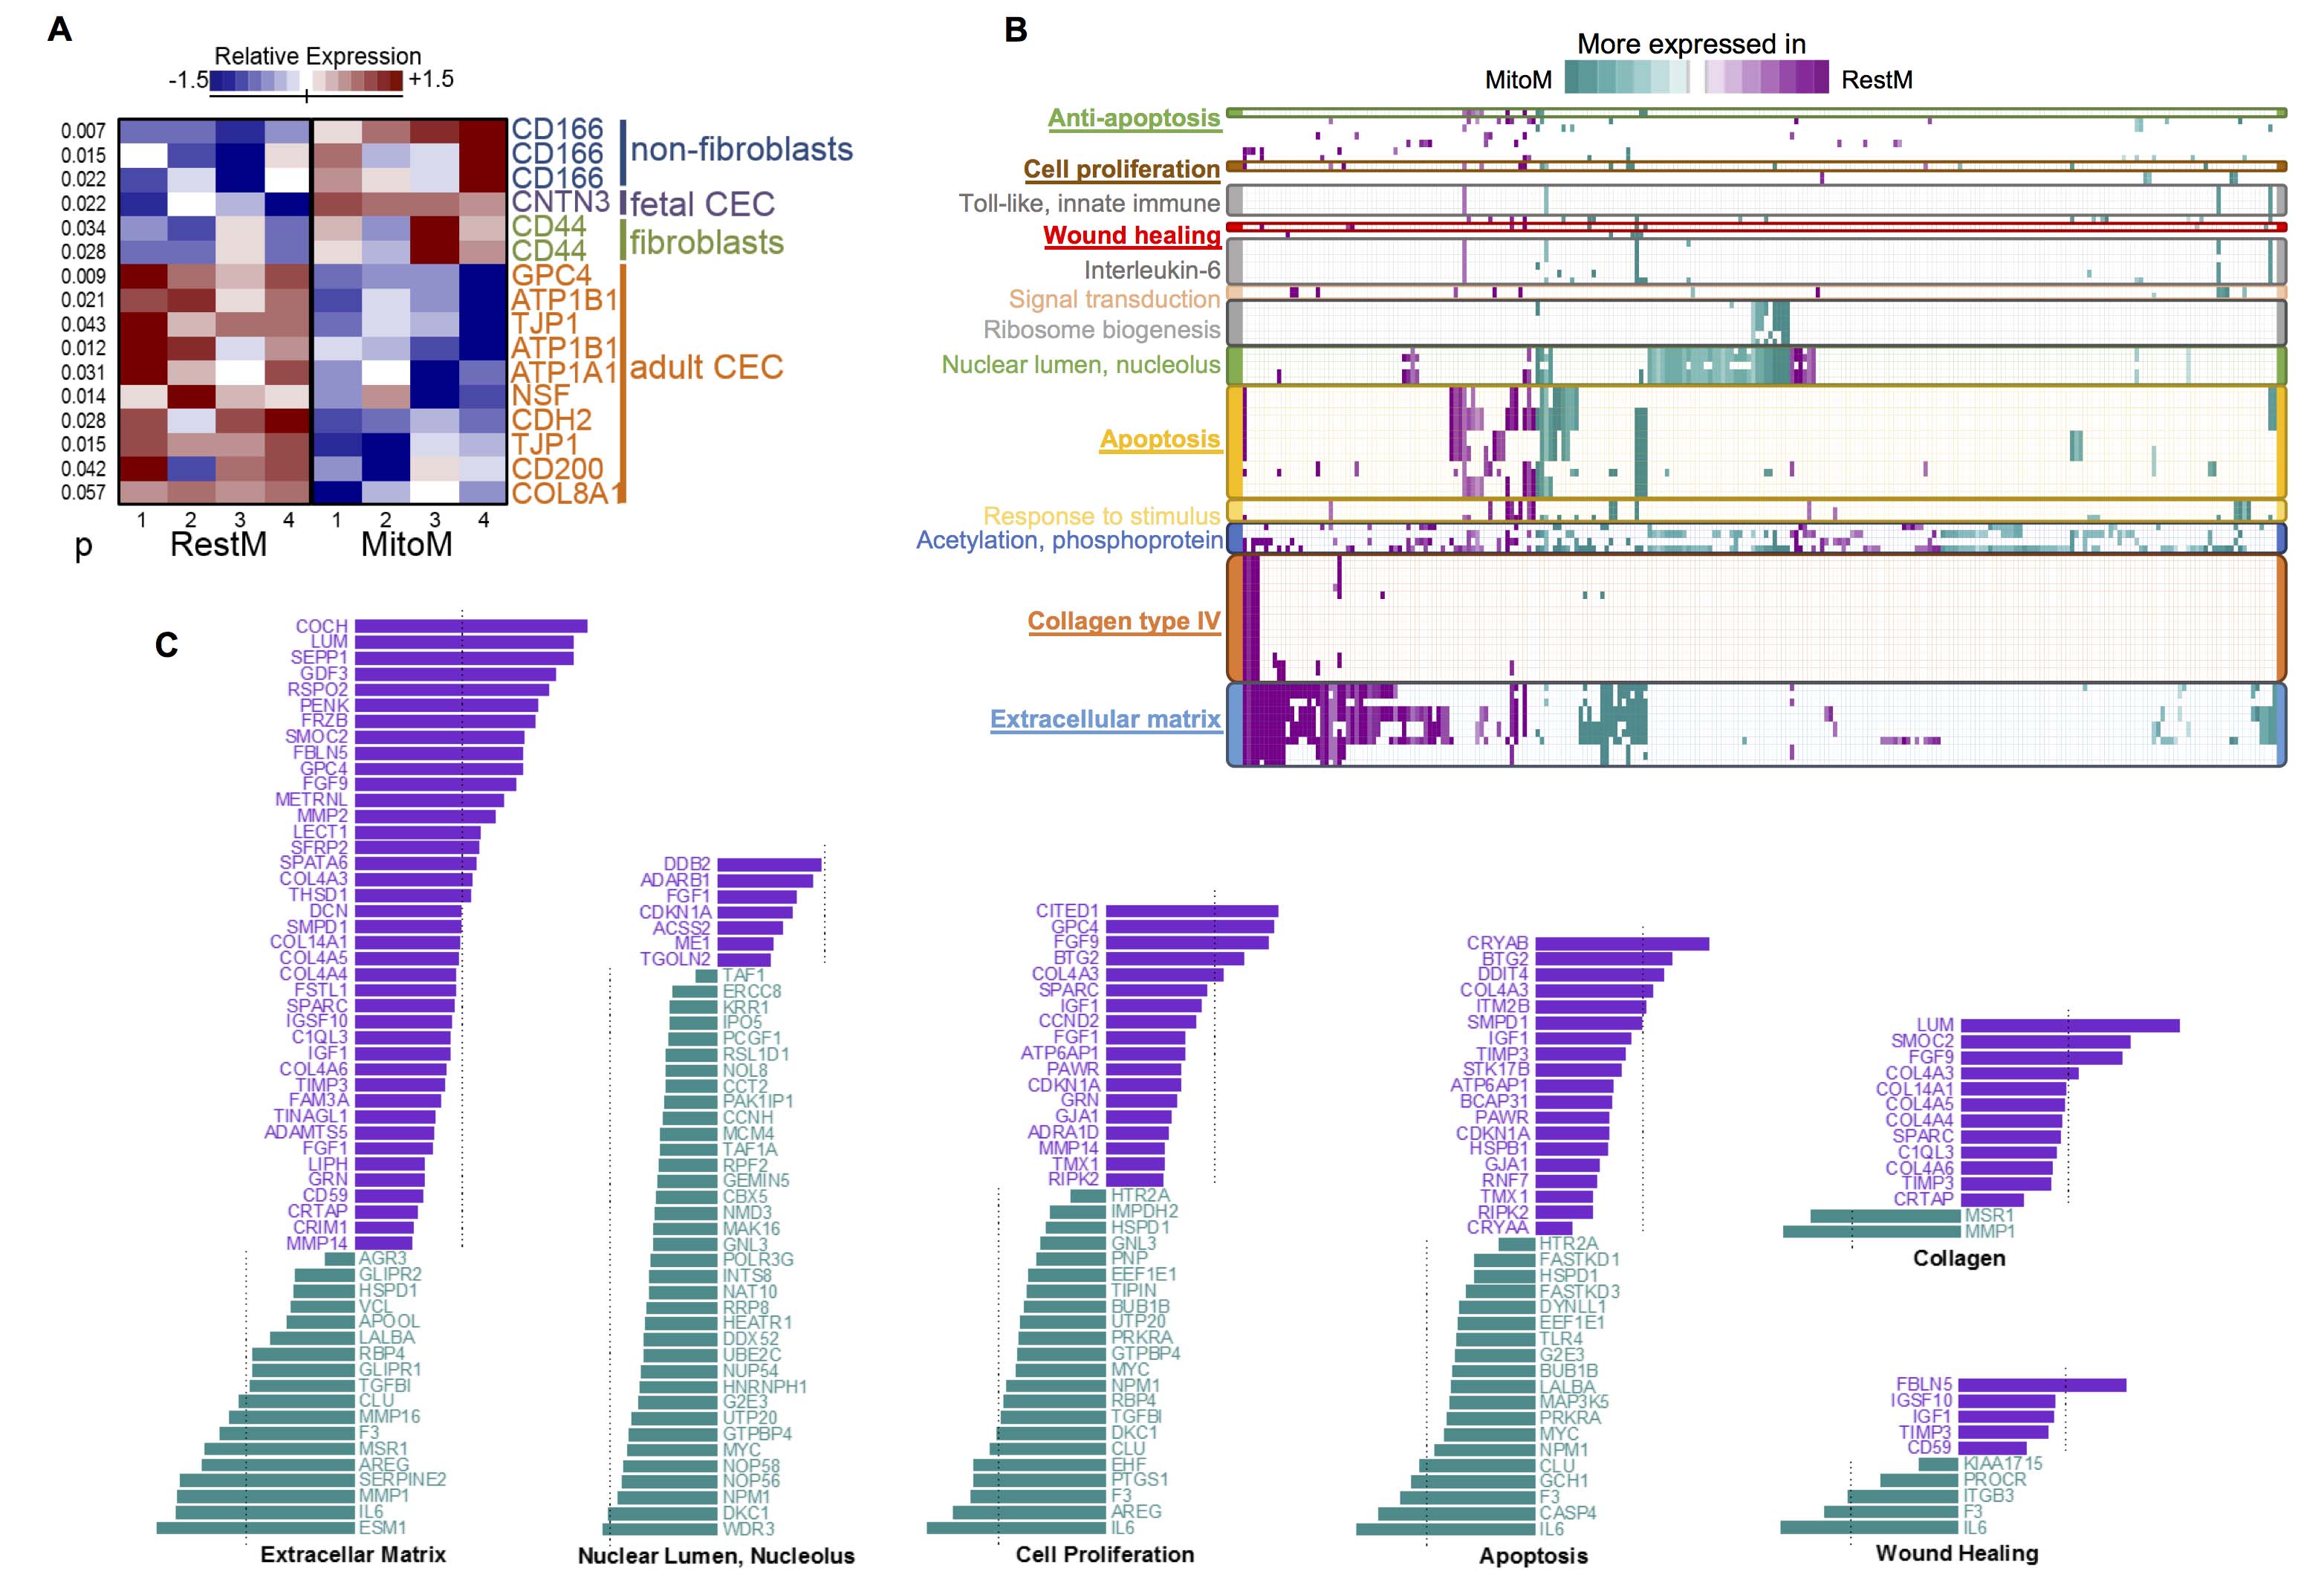
 Figure 3 of
Rodríguez-Barrientos, Mol Vis 2019; 25:745-xxx.
Figure 3 of
Rodríguez-Barrientos, Mol Vis 2019; 25:745-xxx.