Figure 2. Overall gene expression comparison among the biological replicates 1, 2, 3, and 4. A: Hierarchical clustering comparing all probes in the microarray. B: First and second principal components. The percentage of the total explained variability is shown in the axis labels. PC1
seems to be associated with treatment. C: Hierarchical clustering using 5% of the probes with the highest variability.
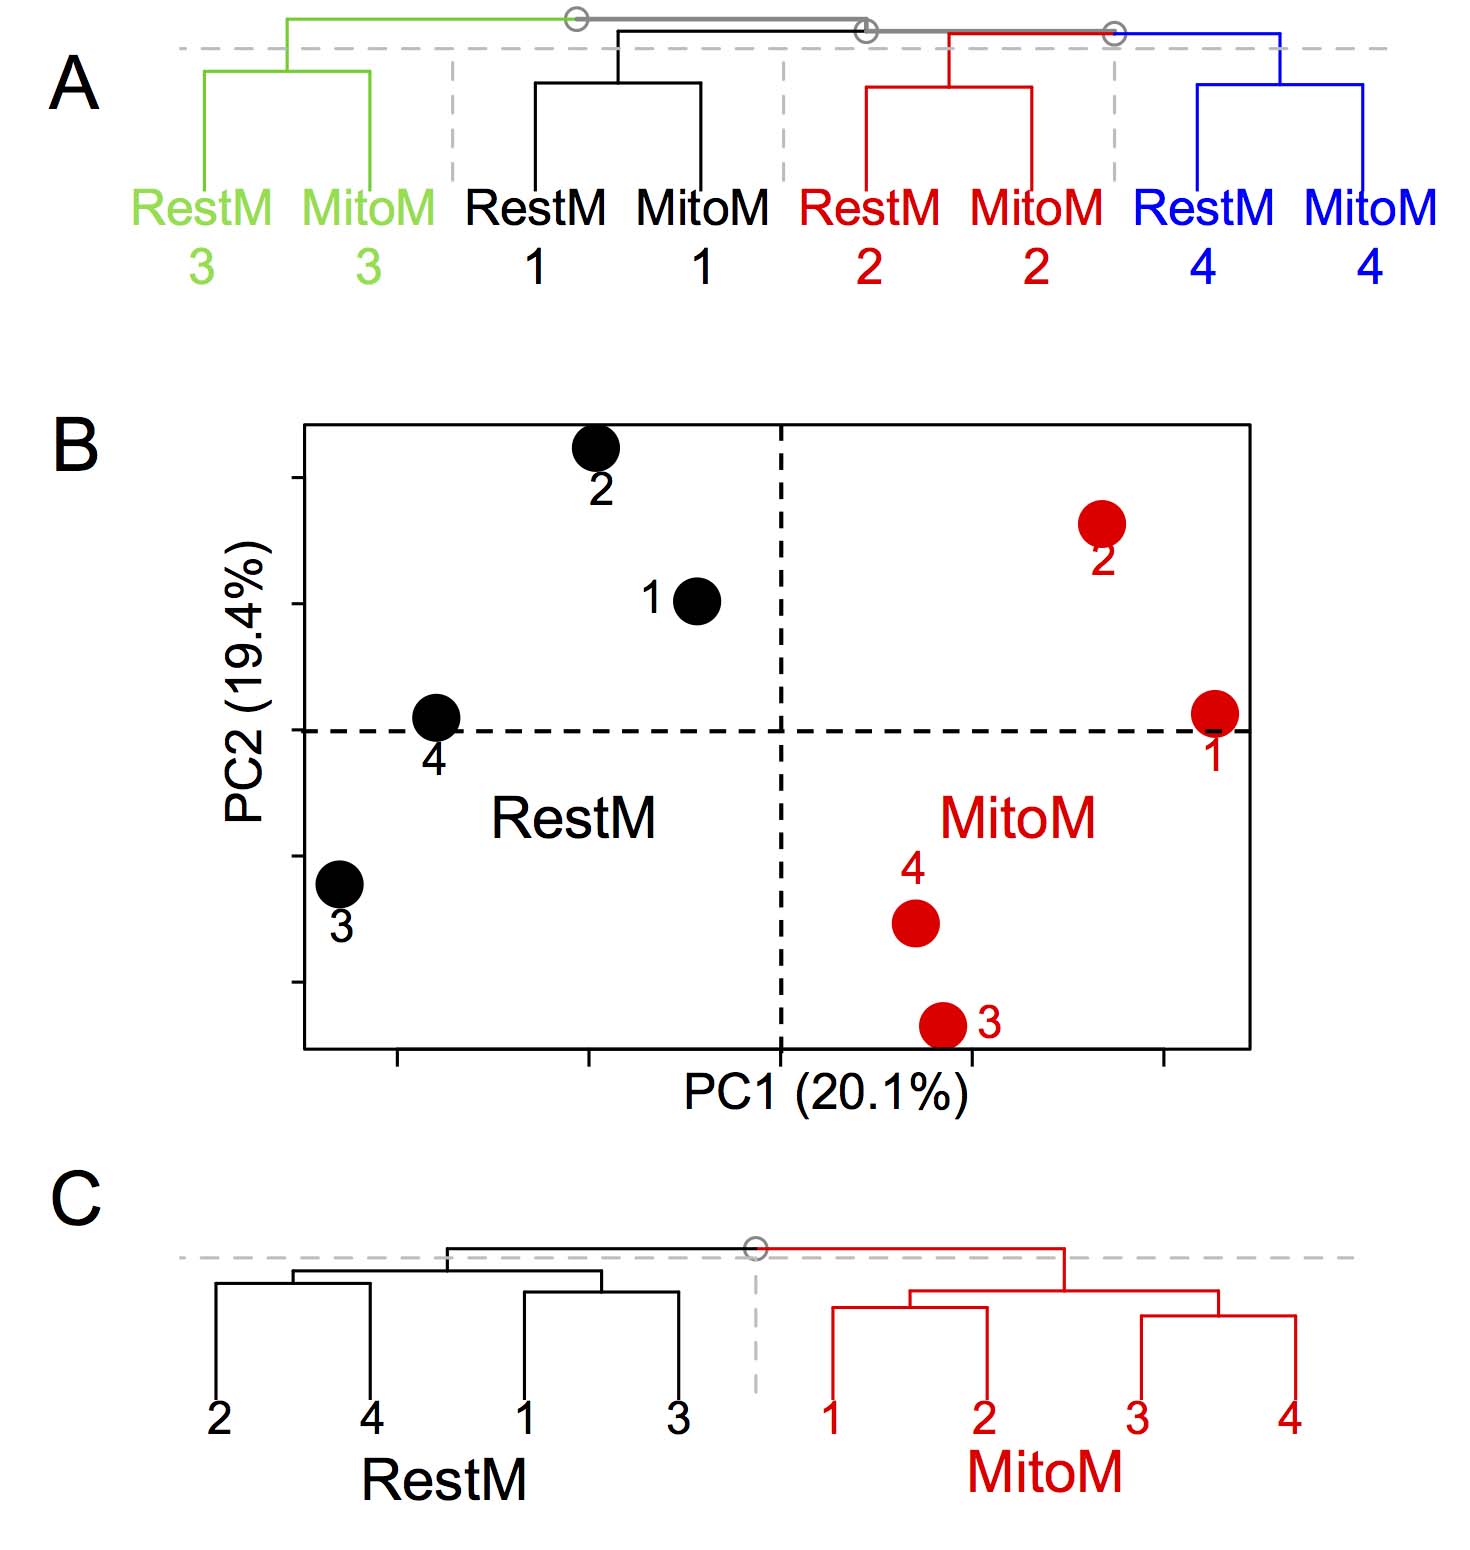
 Figure 2 of
Rodríguez-Barrientos, Mol Vis 2019; 25:745-xxx.
Figure 2 of
Rodríguez-Barrientos, Mol Vis 2019; 25:745-xxx.