Figure 5. Differences in p-PKA, GSK-3β (S9), and CRMP2 (T514) expression among the control, miR-30b mimic, Fc-Sema3A, and miRNA NC groups.
A: WB showing p-PKA, GSK-3β (S9), and CRMP (T514) expression after transfection with miR-30b mimic or 1μg/mL Fc-Sema3A. B: Fluorescence intensity of CRMP2 (T514) in the different groups after 60 h of culture (n=3 cultures; p<0.05, **P<0.01 compared
to miRNA NC or control; #p<0.05, ##p<0.01 compared to the alternative dose).
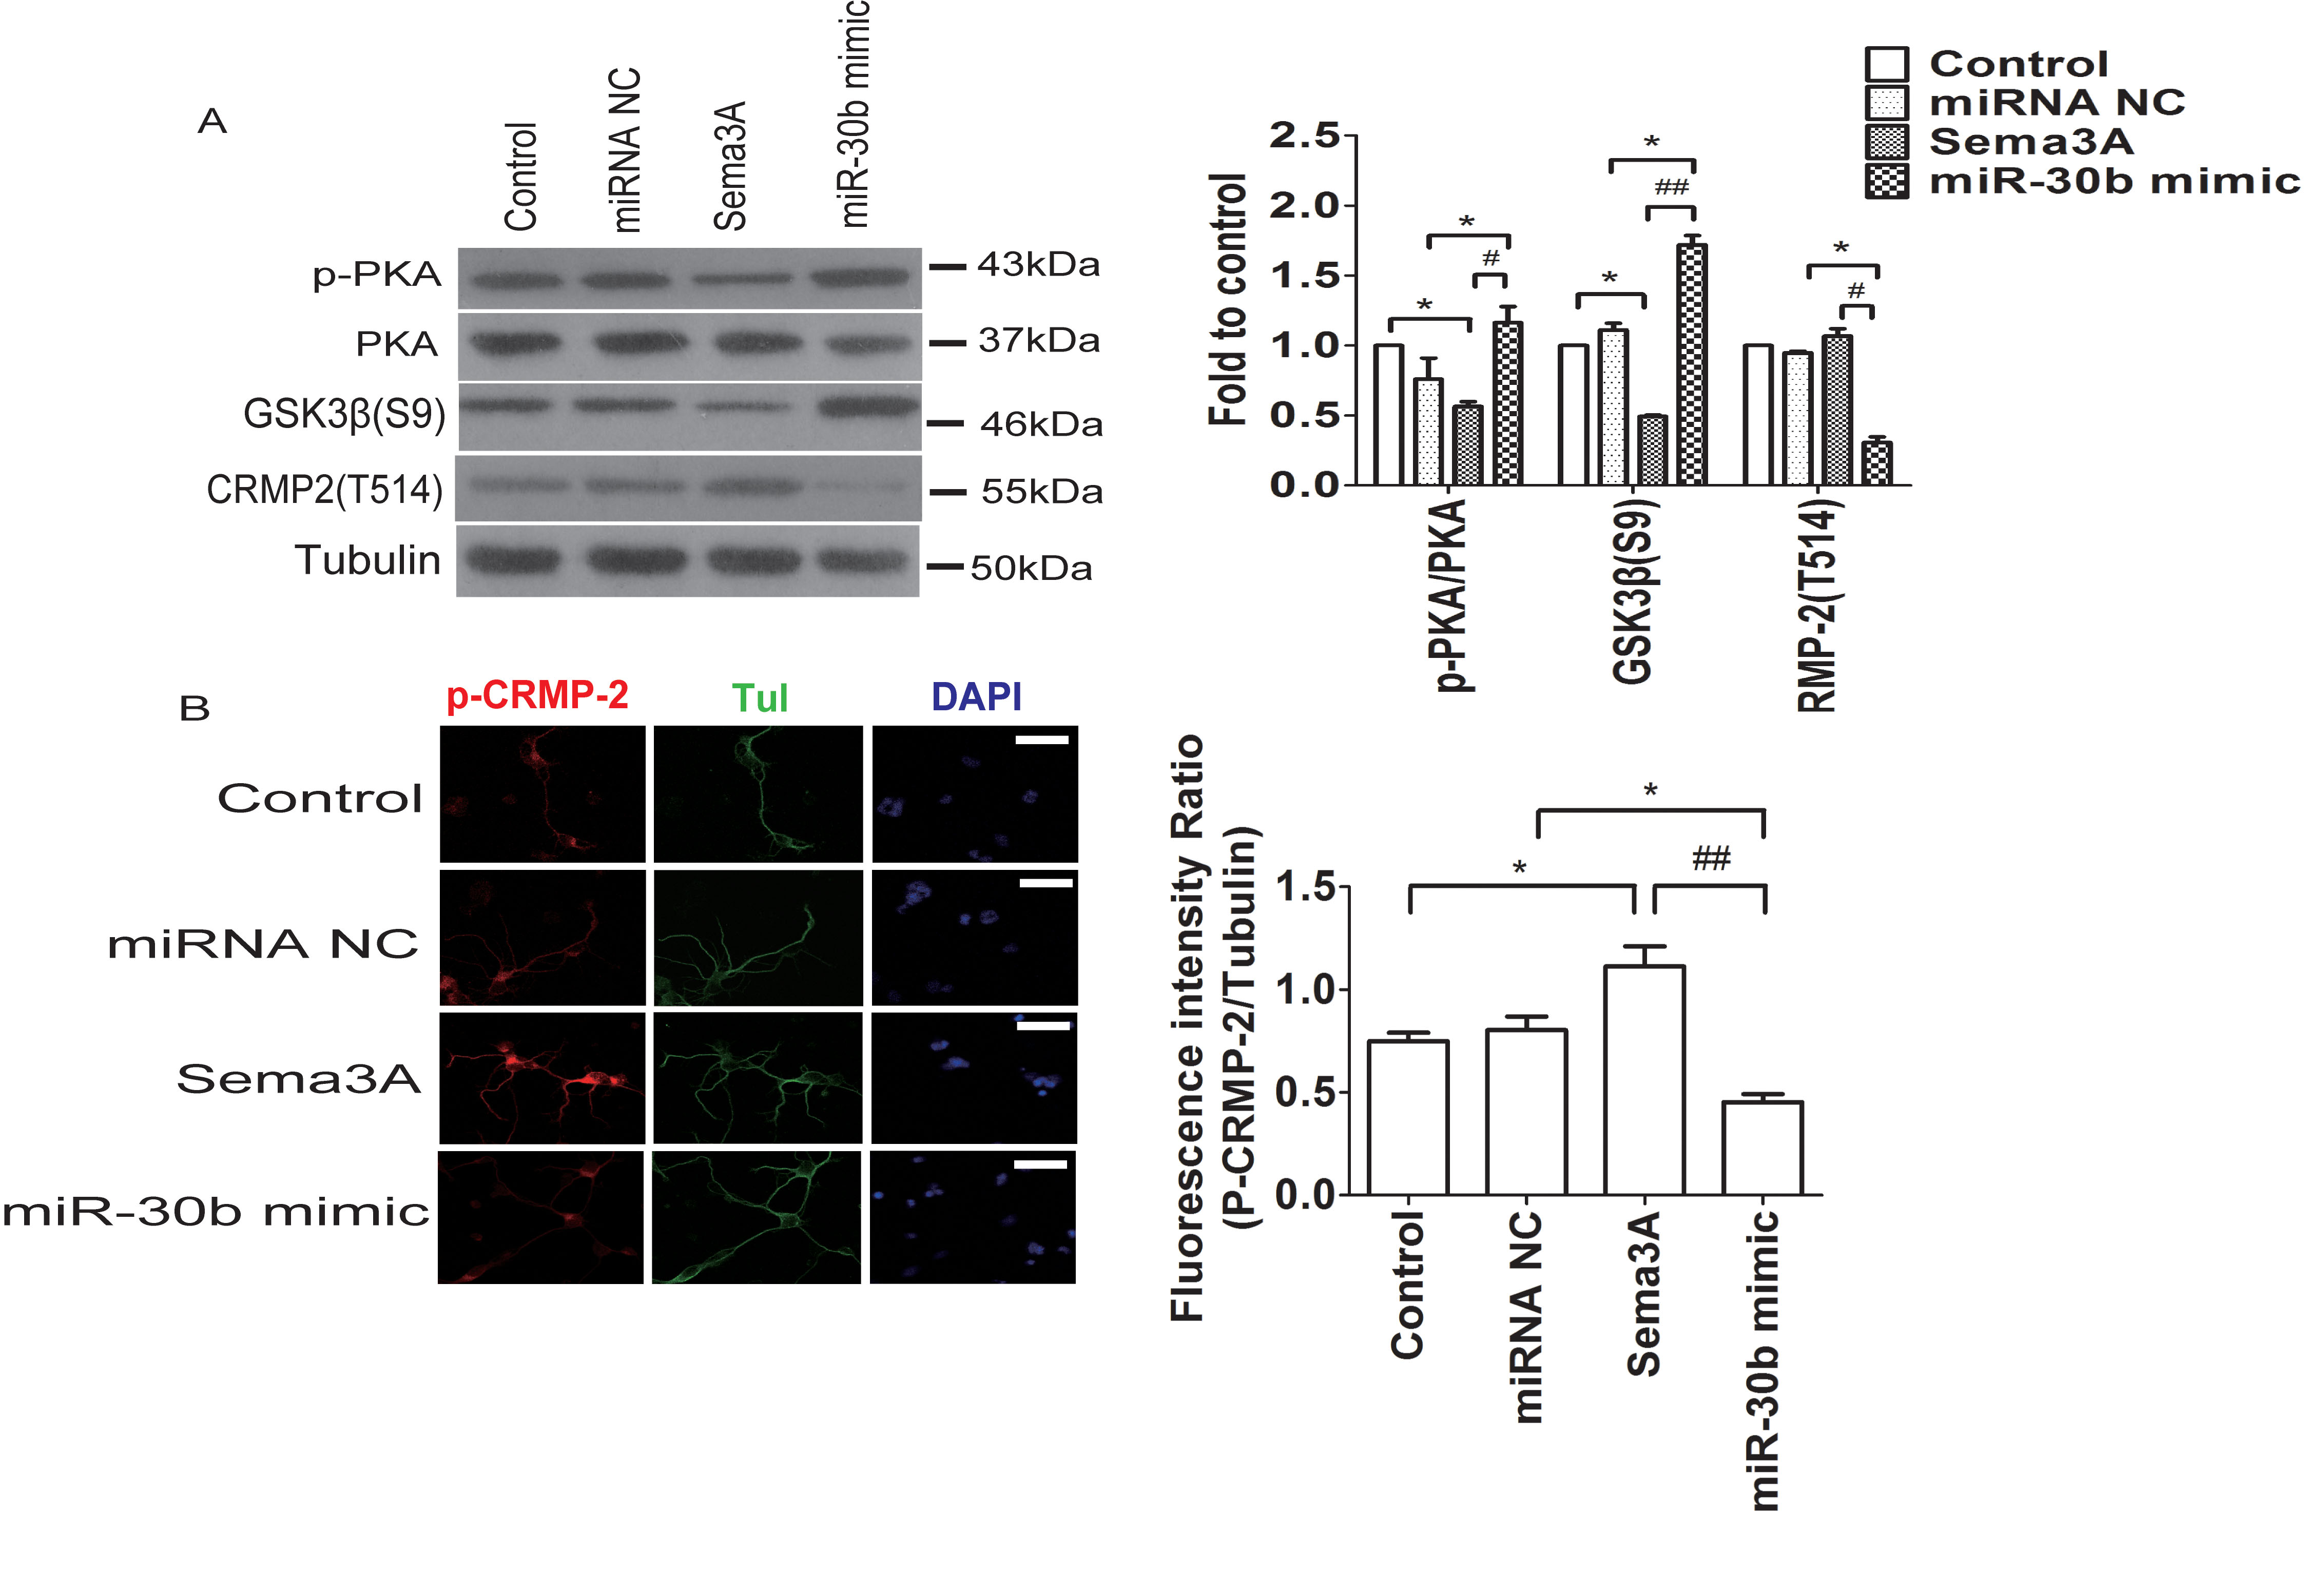
 Figure 5 of
Chan-Juan, Mol Vis 2019; 25:722-730.
Figure 5 of
Chan-Juan, Mol Vis 2019; 25:722-730.