Figure 2. Changes in Sema3A protein content in each group. A: WB showing Sema3A expression in RGCs cultured for 3 d, 7 d, or 10 d. B: The expression of Sema3A in cultured RGCs transfected with miR-30b mimic, inhibitor, miRNA NC, or Sema3A siRNA at 120-140
h (n=3). *p<0.05 compared to control siRNA.
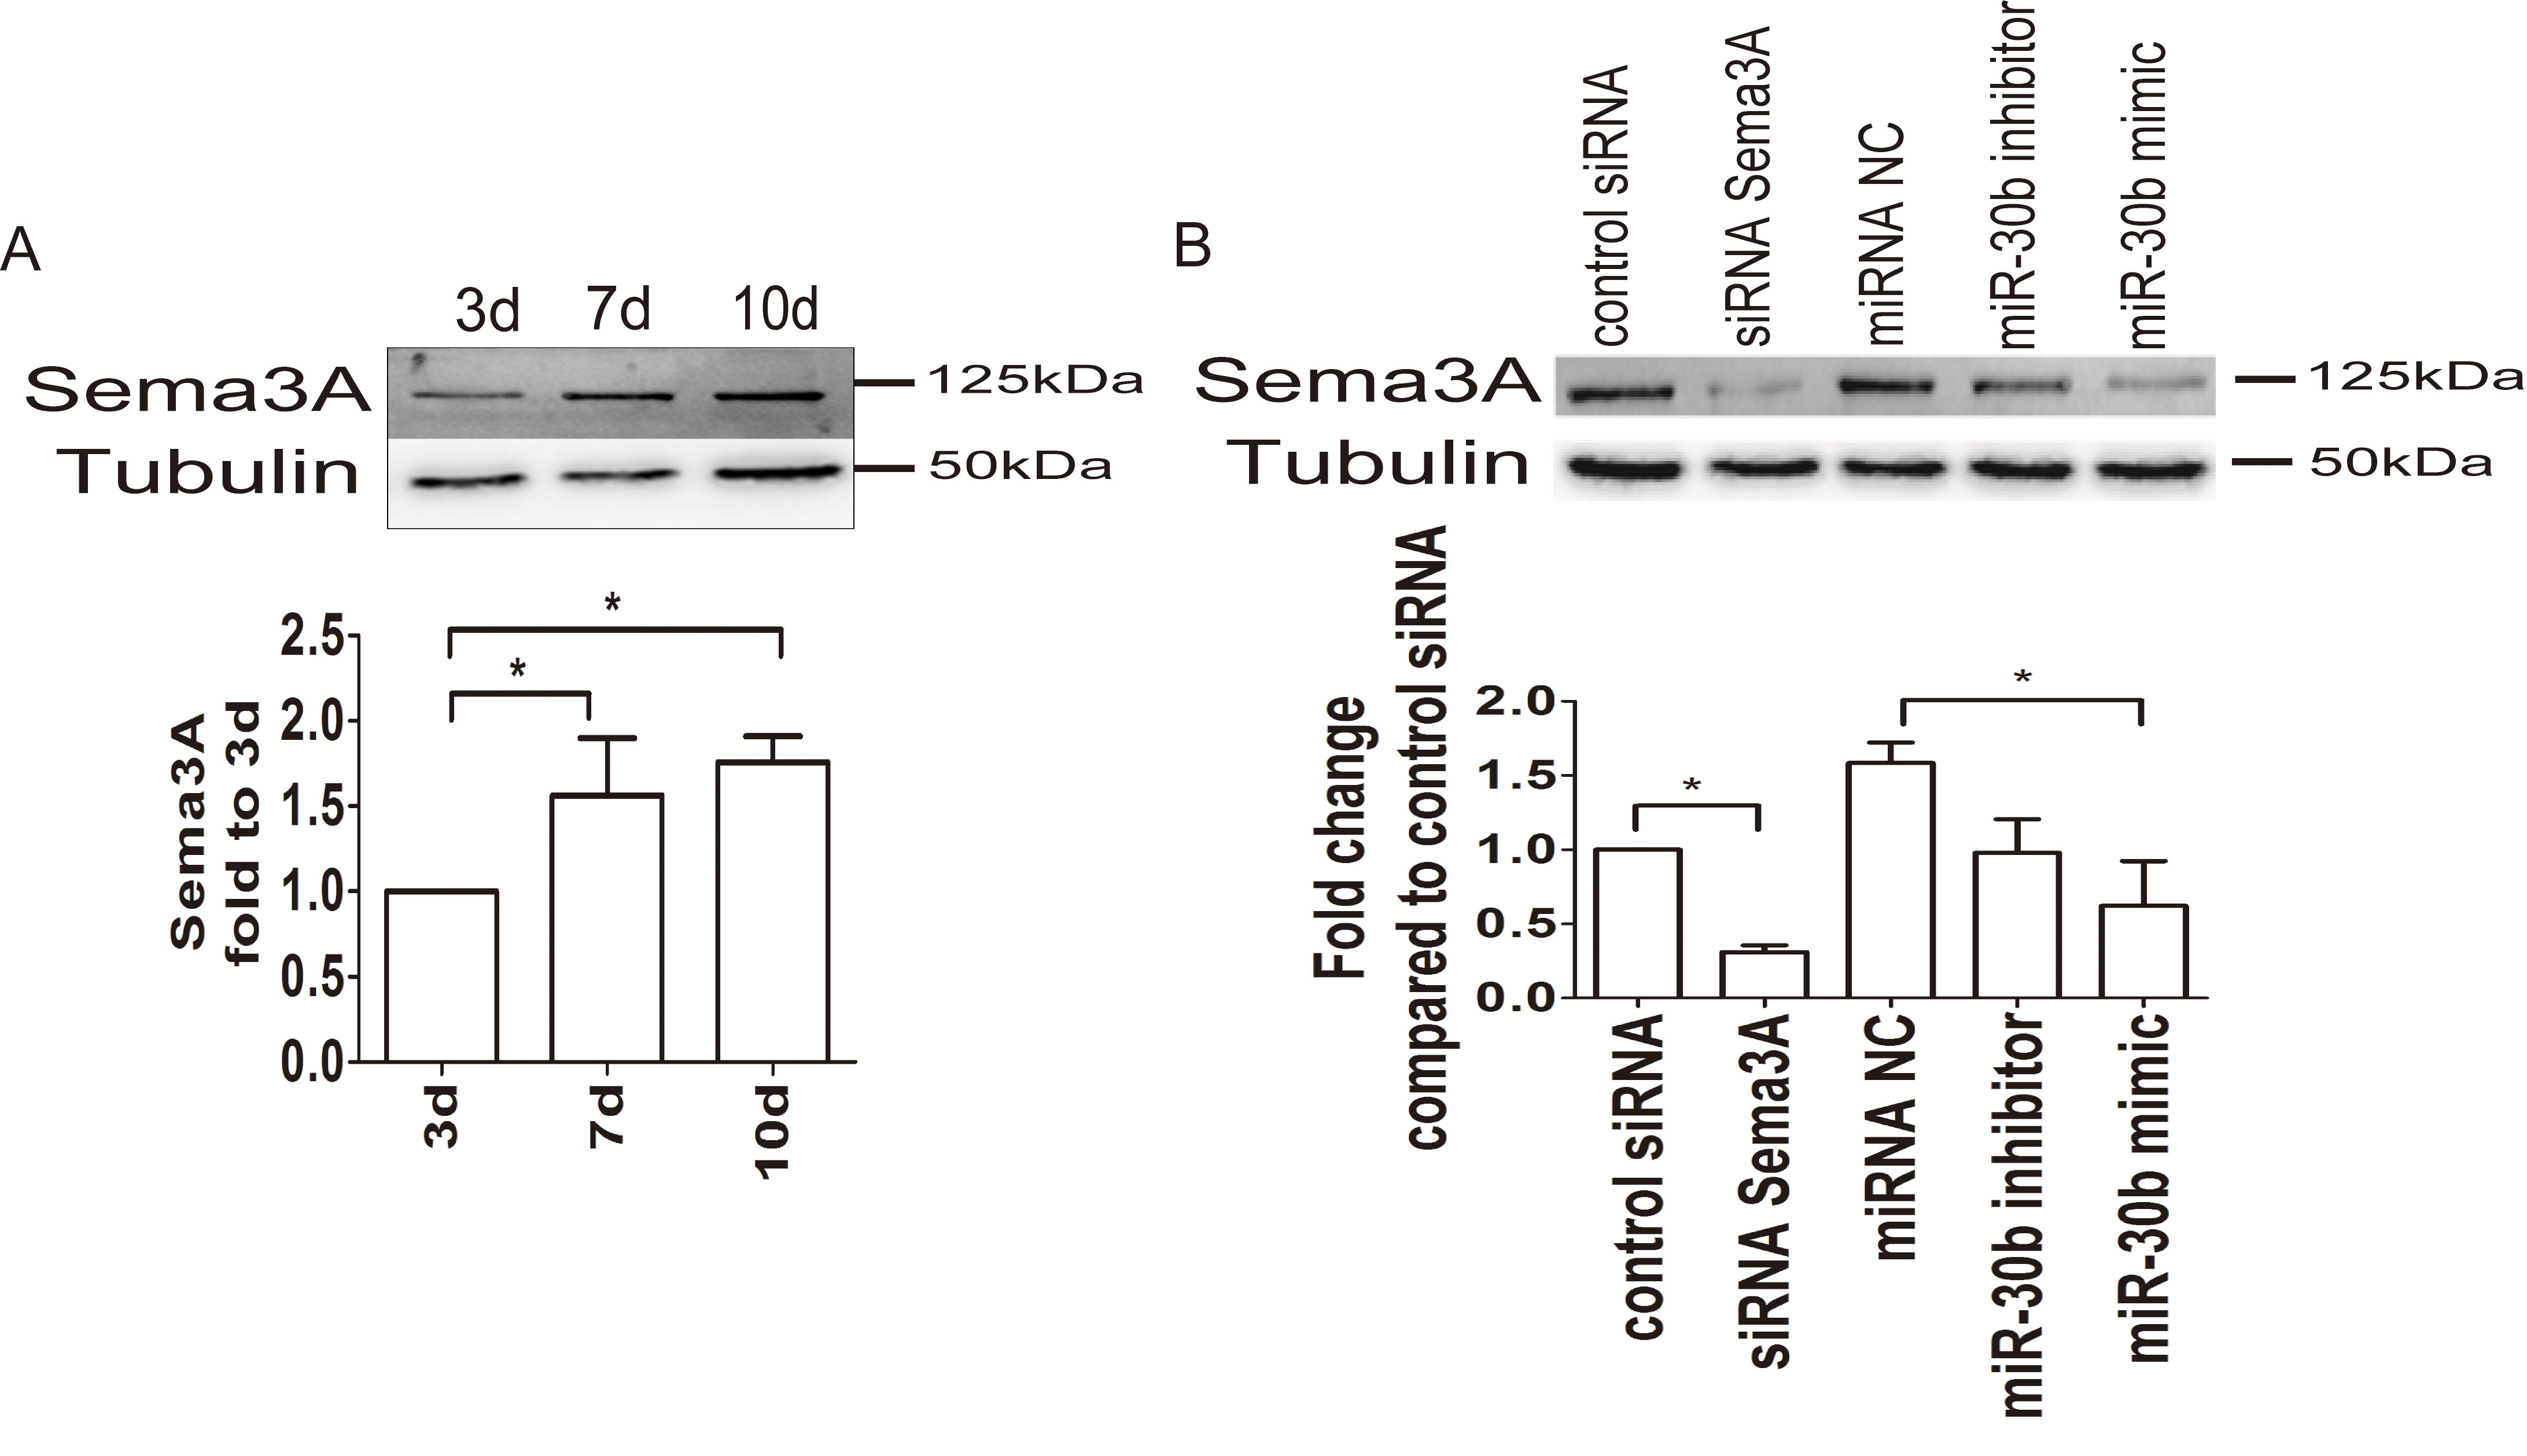
 Figure 2 of
Chan-Juan, Mol Vis 2019; 25:722-730.
Figure 2 of
Chan-Juan, Mol Vis 2019; 25:722-730.