Figure 2. The Sox9 knockdown preserved retinal morphology as measured by HE staining. Representative photomicrographs show the histological
appearance of retinas from the control and Sox9-shRNA groups on days 3, 7, and 14 after light expose (A-H). All the pictures were taken of the superior regions (approximately 1.0 mm from the optic disc) of the retinas. Note that
the mean thickness of the ONL was better preserved in the Sox9-shRNA group (D, F, H) than the control (C, E, G) at each time point. I: The morphometric analysis of the thickness of the ONL shows a significant preservation in the Sox9-shRNA group compared
with the control group. Mean ± SD (n = 4), t test, *p<0.05. Scale bar, 50 μm.
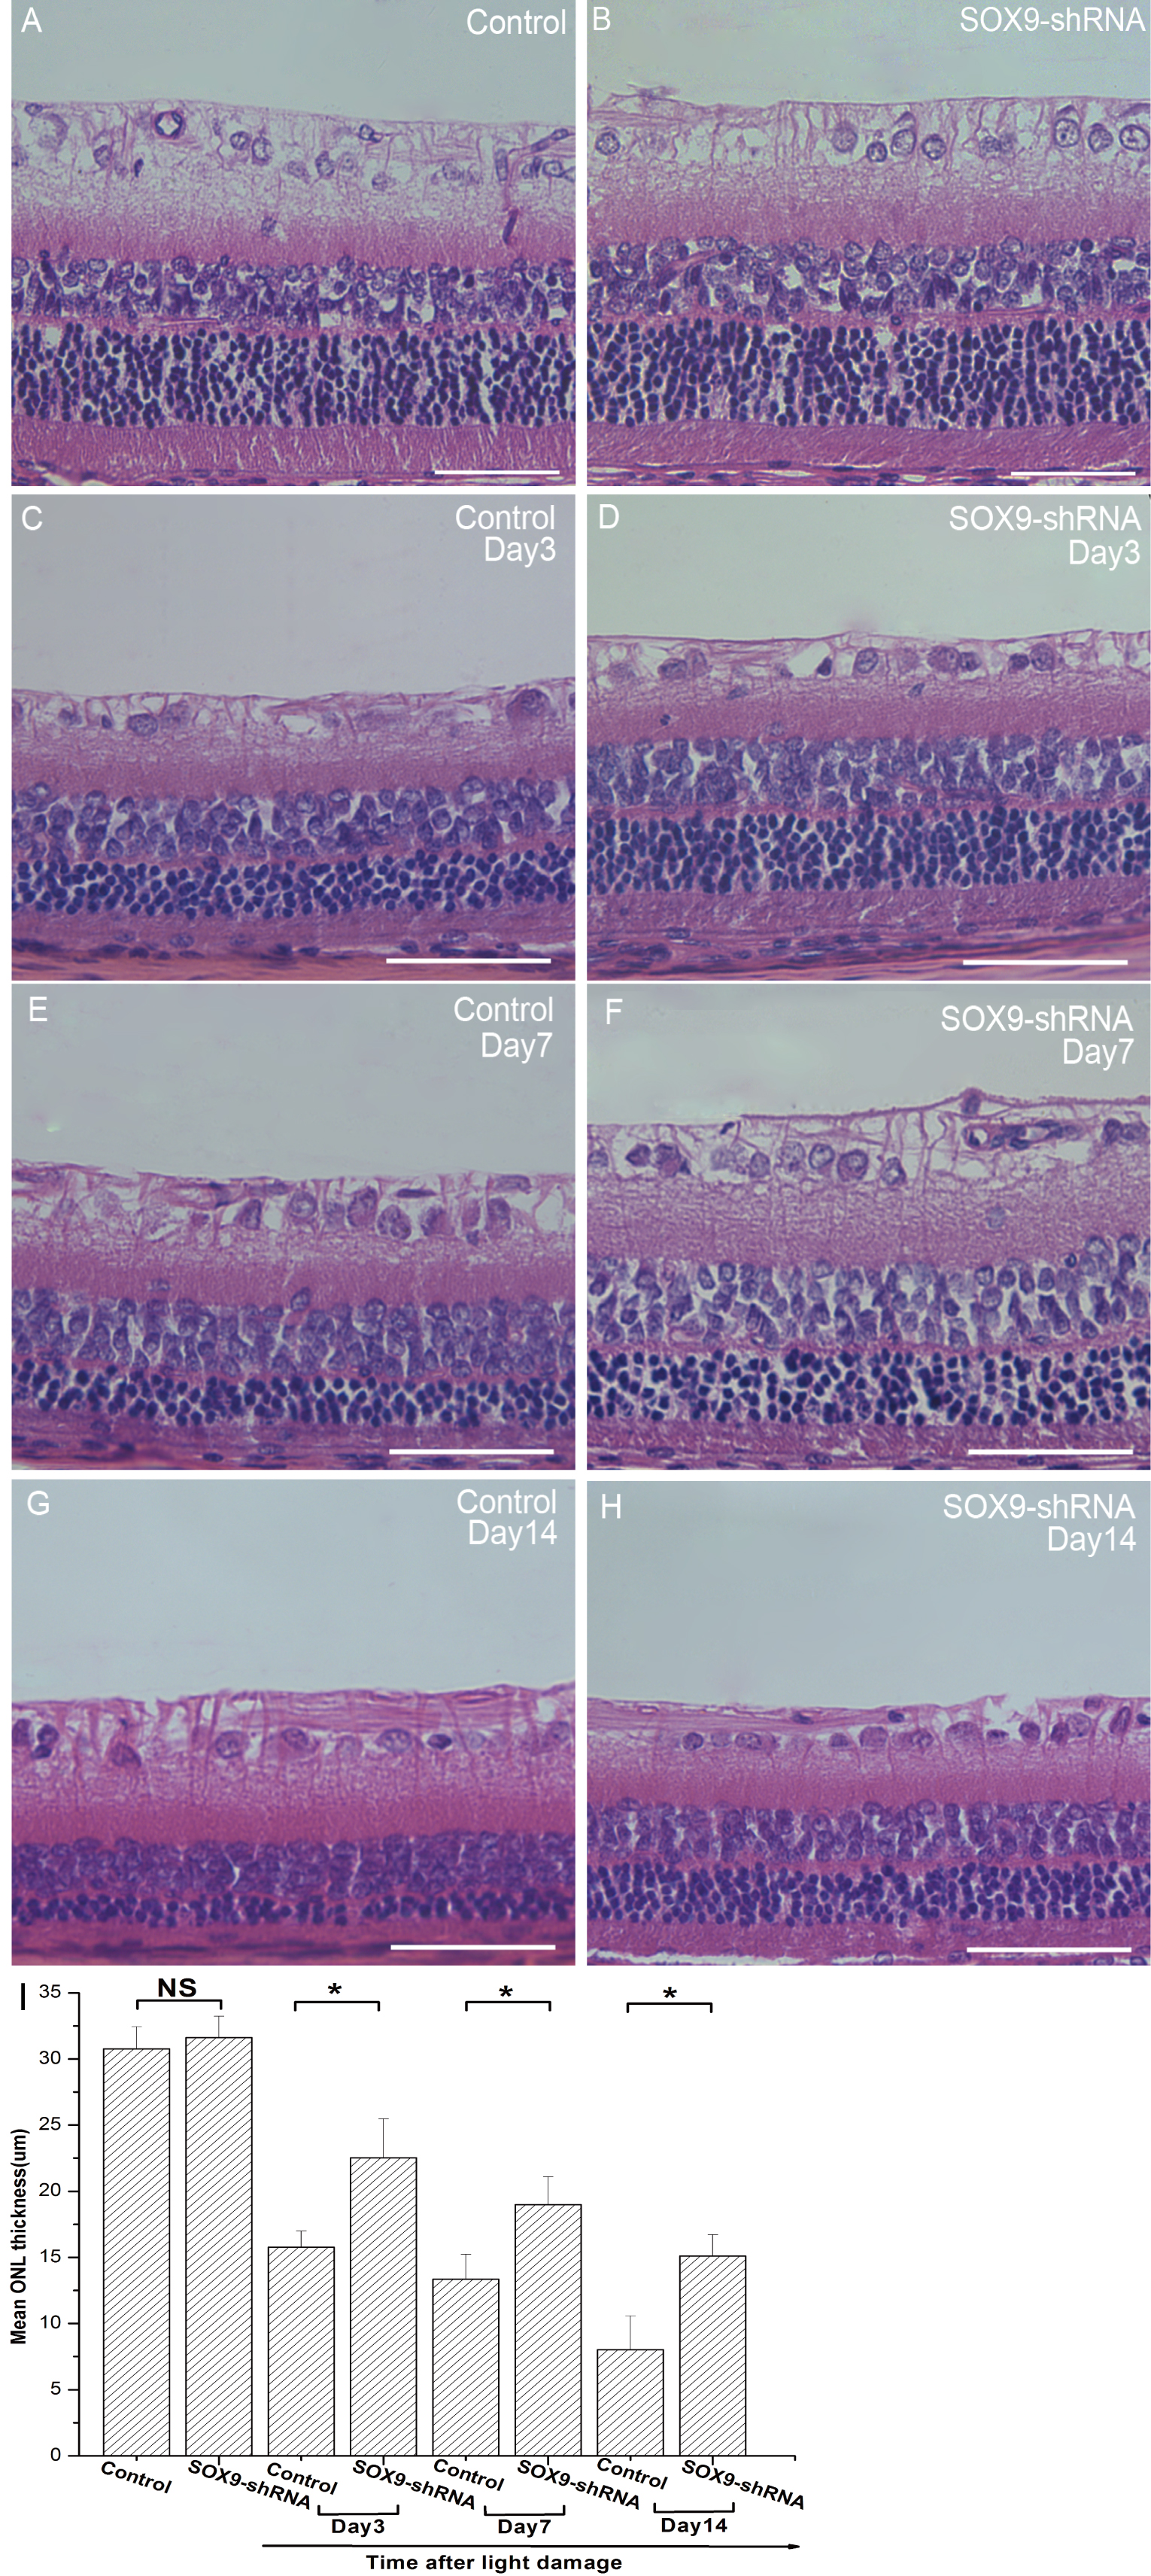
 Figure 2 of
Wang, Mol Vis 2019; 25:703-713.
Figure 2 of
Wang, Mol Vis 2019; 25:703-713.