Figure 4. Transcriptome analysis of D90 and D120 organoids treated with ATRA or 9CRAL. A: Coinertia analysis projecting ordinations of maximum covariation of D90 and D120 all-trans retinoic acid (ATRA) and 9-cis
retinal (9CRAL) organoids with human fetal transcriptome data. B: Venn diagram revealing differentially expressed (DE) genes during differentiation between ATRA and 9CRAL organoids. C: Heatmap of 594 common DE genes, sorted and clustered based on row-wise z-score expression values in H9. Five clusters are
evident. D: Reduced-redundant Gene Ontology (GO) Biologic Process enrichment analysis of genes in each cluster. E: GO analysis of DE genes comparing 9CRAL to ATRA at D90 and D120 (day-wise comparison). F: Heatmaps showing expression profiles of genes encoding eye field transcription factors and photoreceptor genes.
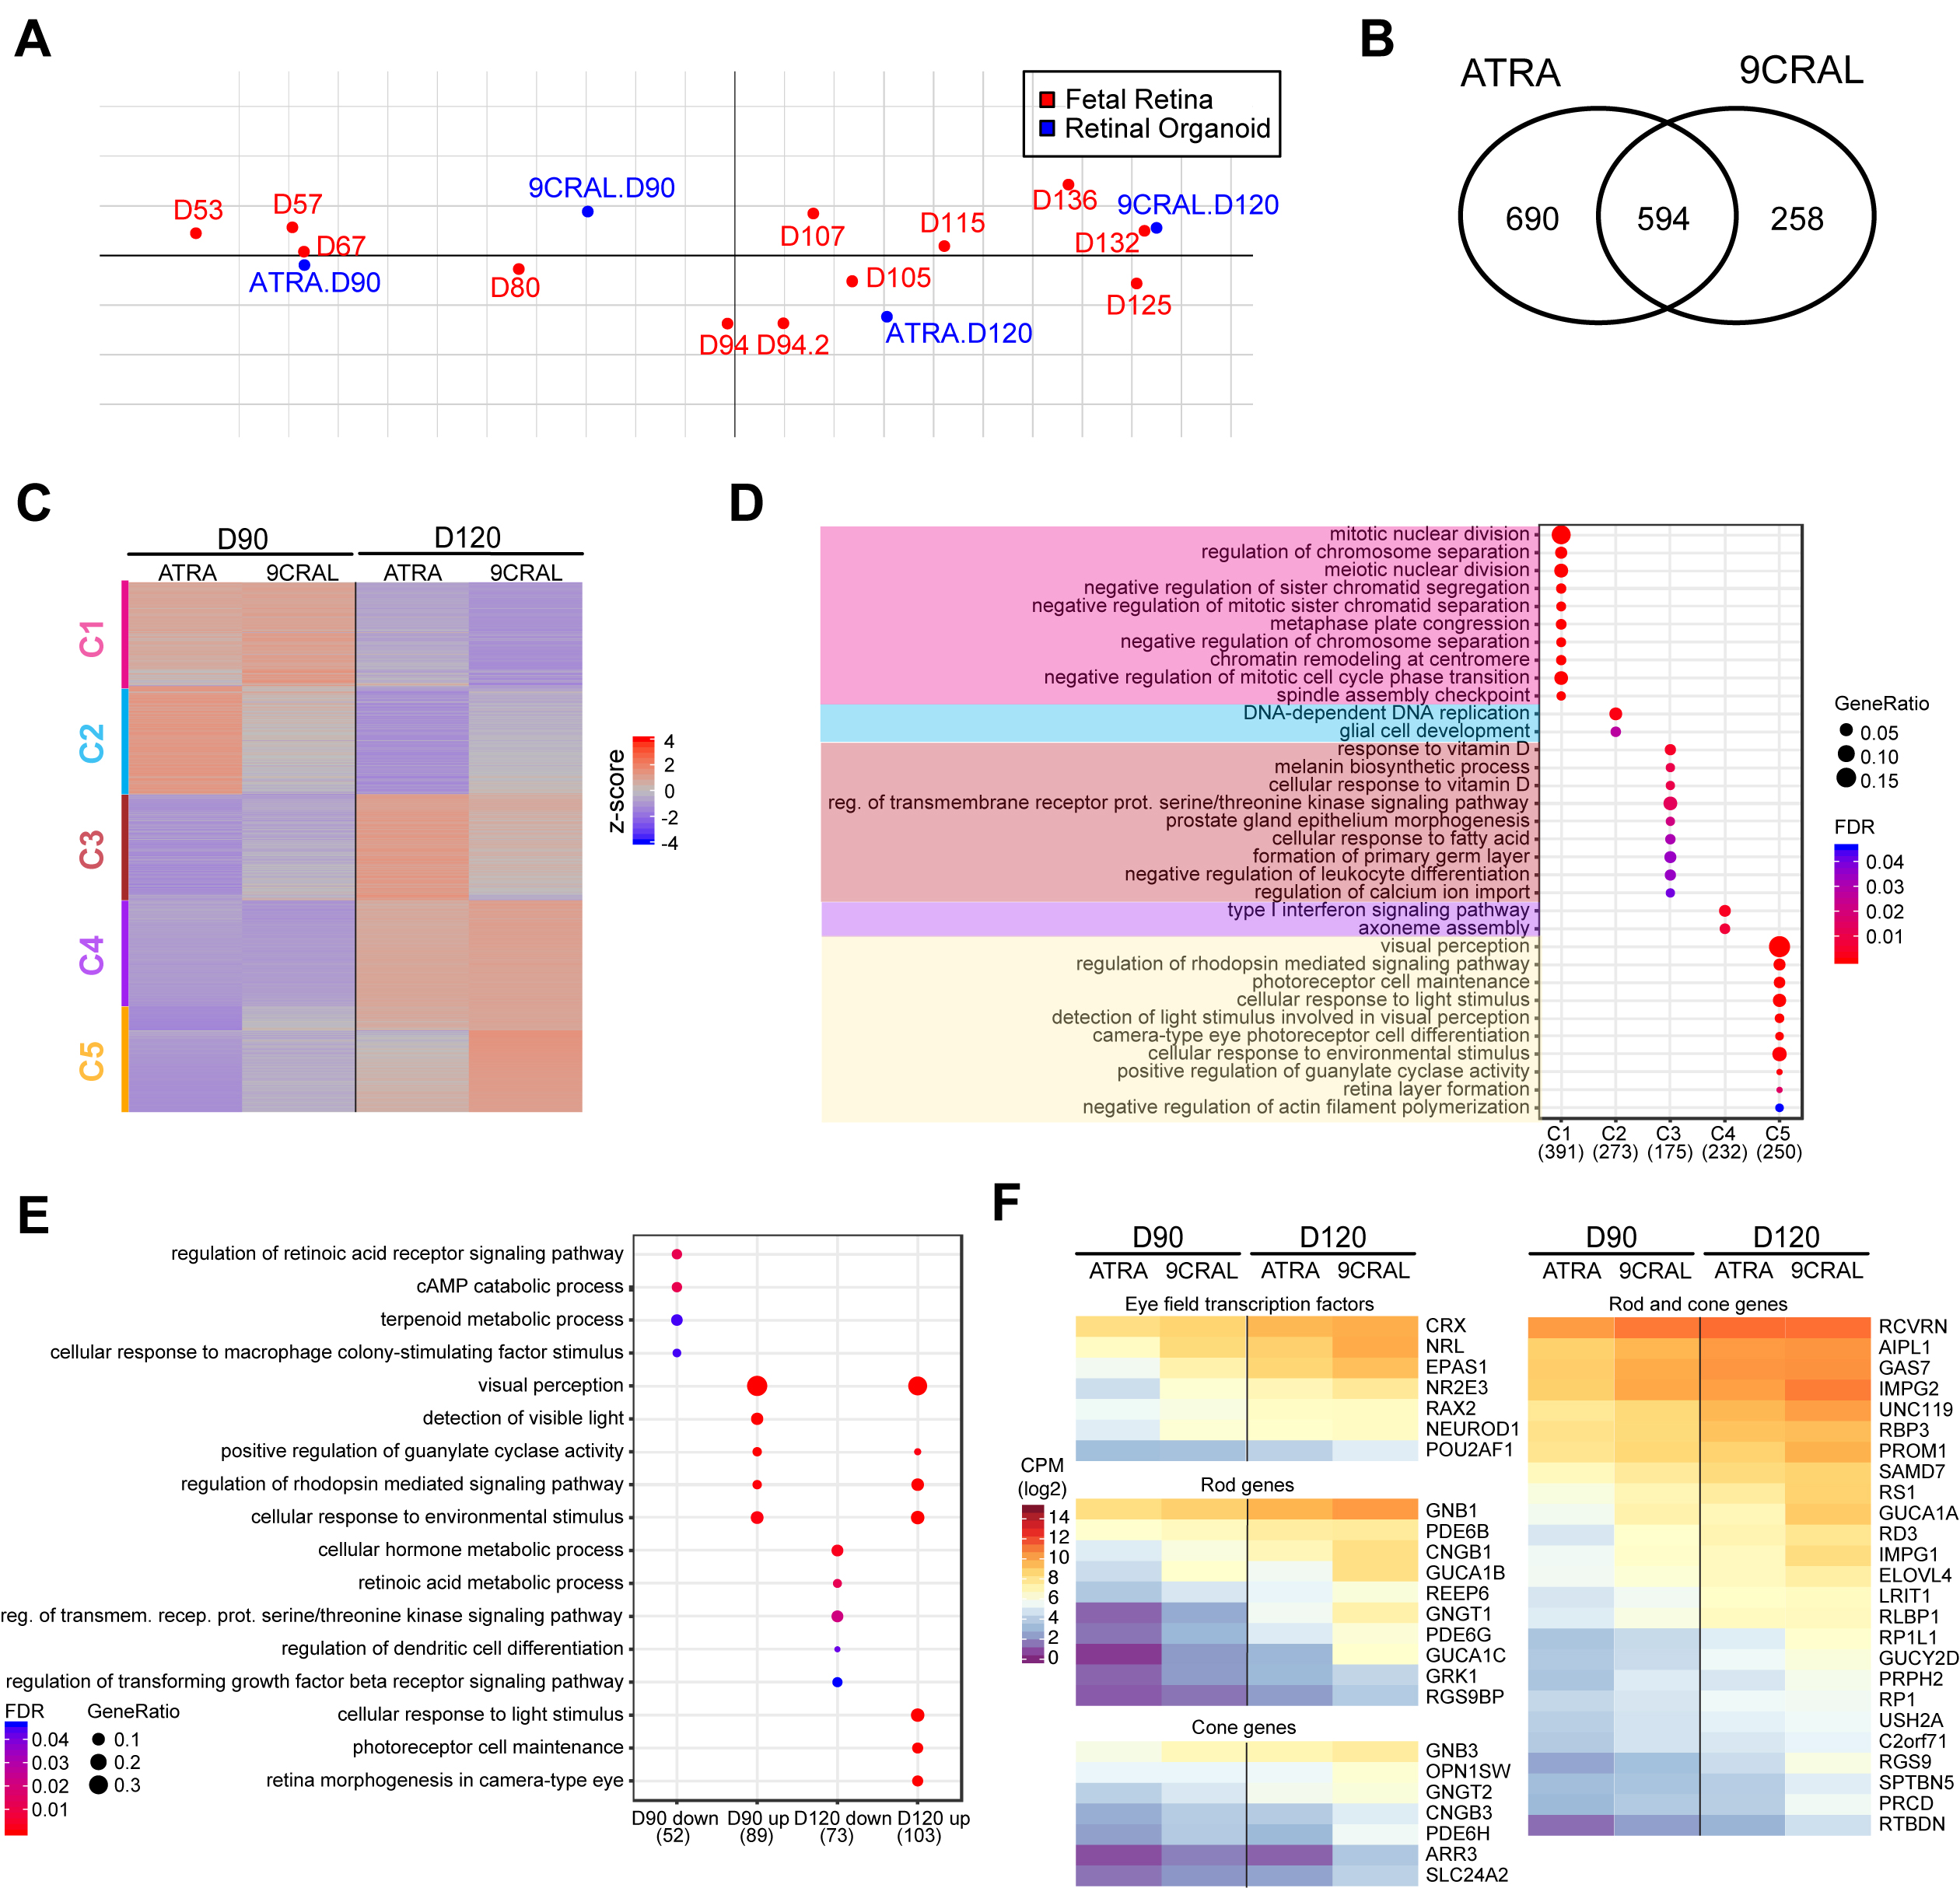
 Figure 4 of
Kaya, Mol Vis 2019; 25:663-678.
Figure 4 of
Kaya, Mol Vis 2019; 25:663-678.