Figure 3. Comparative transcriptome analysis of hPSC-derived organoids and human retinal samples. A: Table showing organoid collection groups (Group 1: D25–37, Group 2: D50–75, Group 3: D80–90, Group 4: D105–125, Group 5:
D145–172, Group 6: D185–200). B: Principal component analysis (PCA) plot of grouped human pluripotent stem cell (hPSC)-derived organoid samples based on
retinal gene expression. PC1 shows the highest variation percentage and relates to time progression, while PC25 shows a non-statistically
significant principle component used for ease of visualization. C: Dynamic time warping analysis showing the local cost matrix (LCM) for all hPSC-derived organoid groups and human fetal (D52–136)
and adult (17, 24, and 28 years) samples. Warmer colors indicate lower levels of global dissimilarity (lowest: red, medium:
orange), whereas cold colors (yellow and blue) represent higher levels of dissimilarity between samples. D: Heatmap demonstrating mean expression count per million (CPM; log2) value expression profiles of phototransduction across all hPSC-derived organoids and human retinal samples.
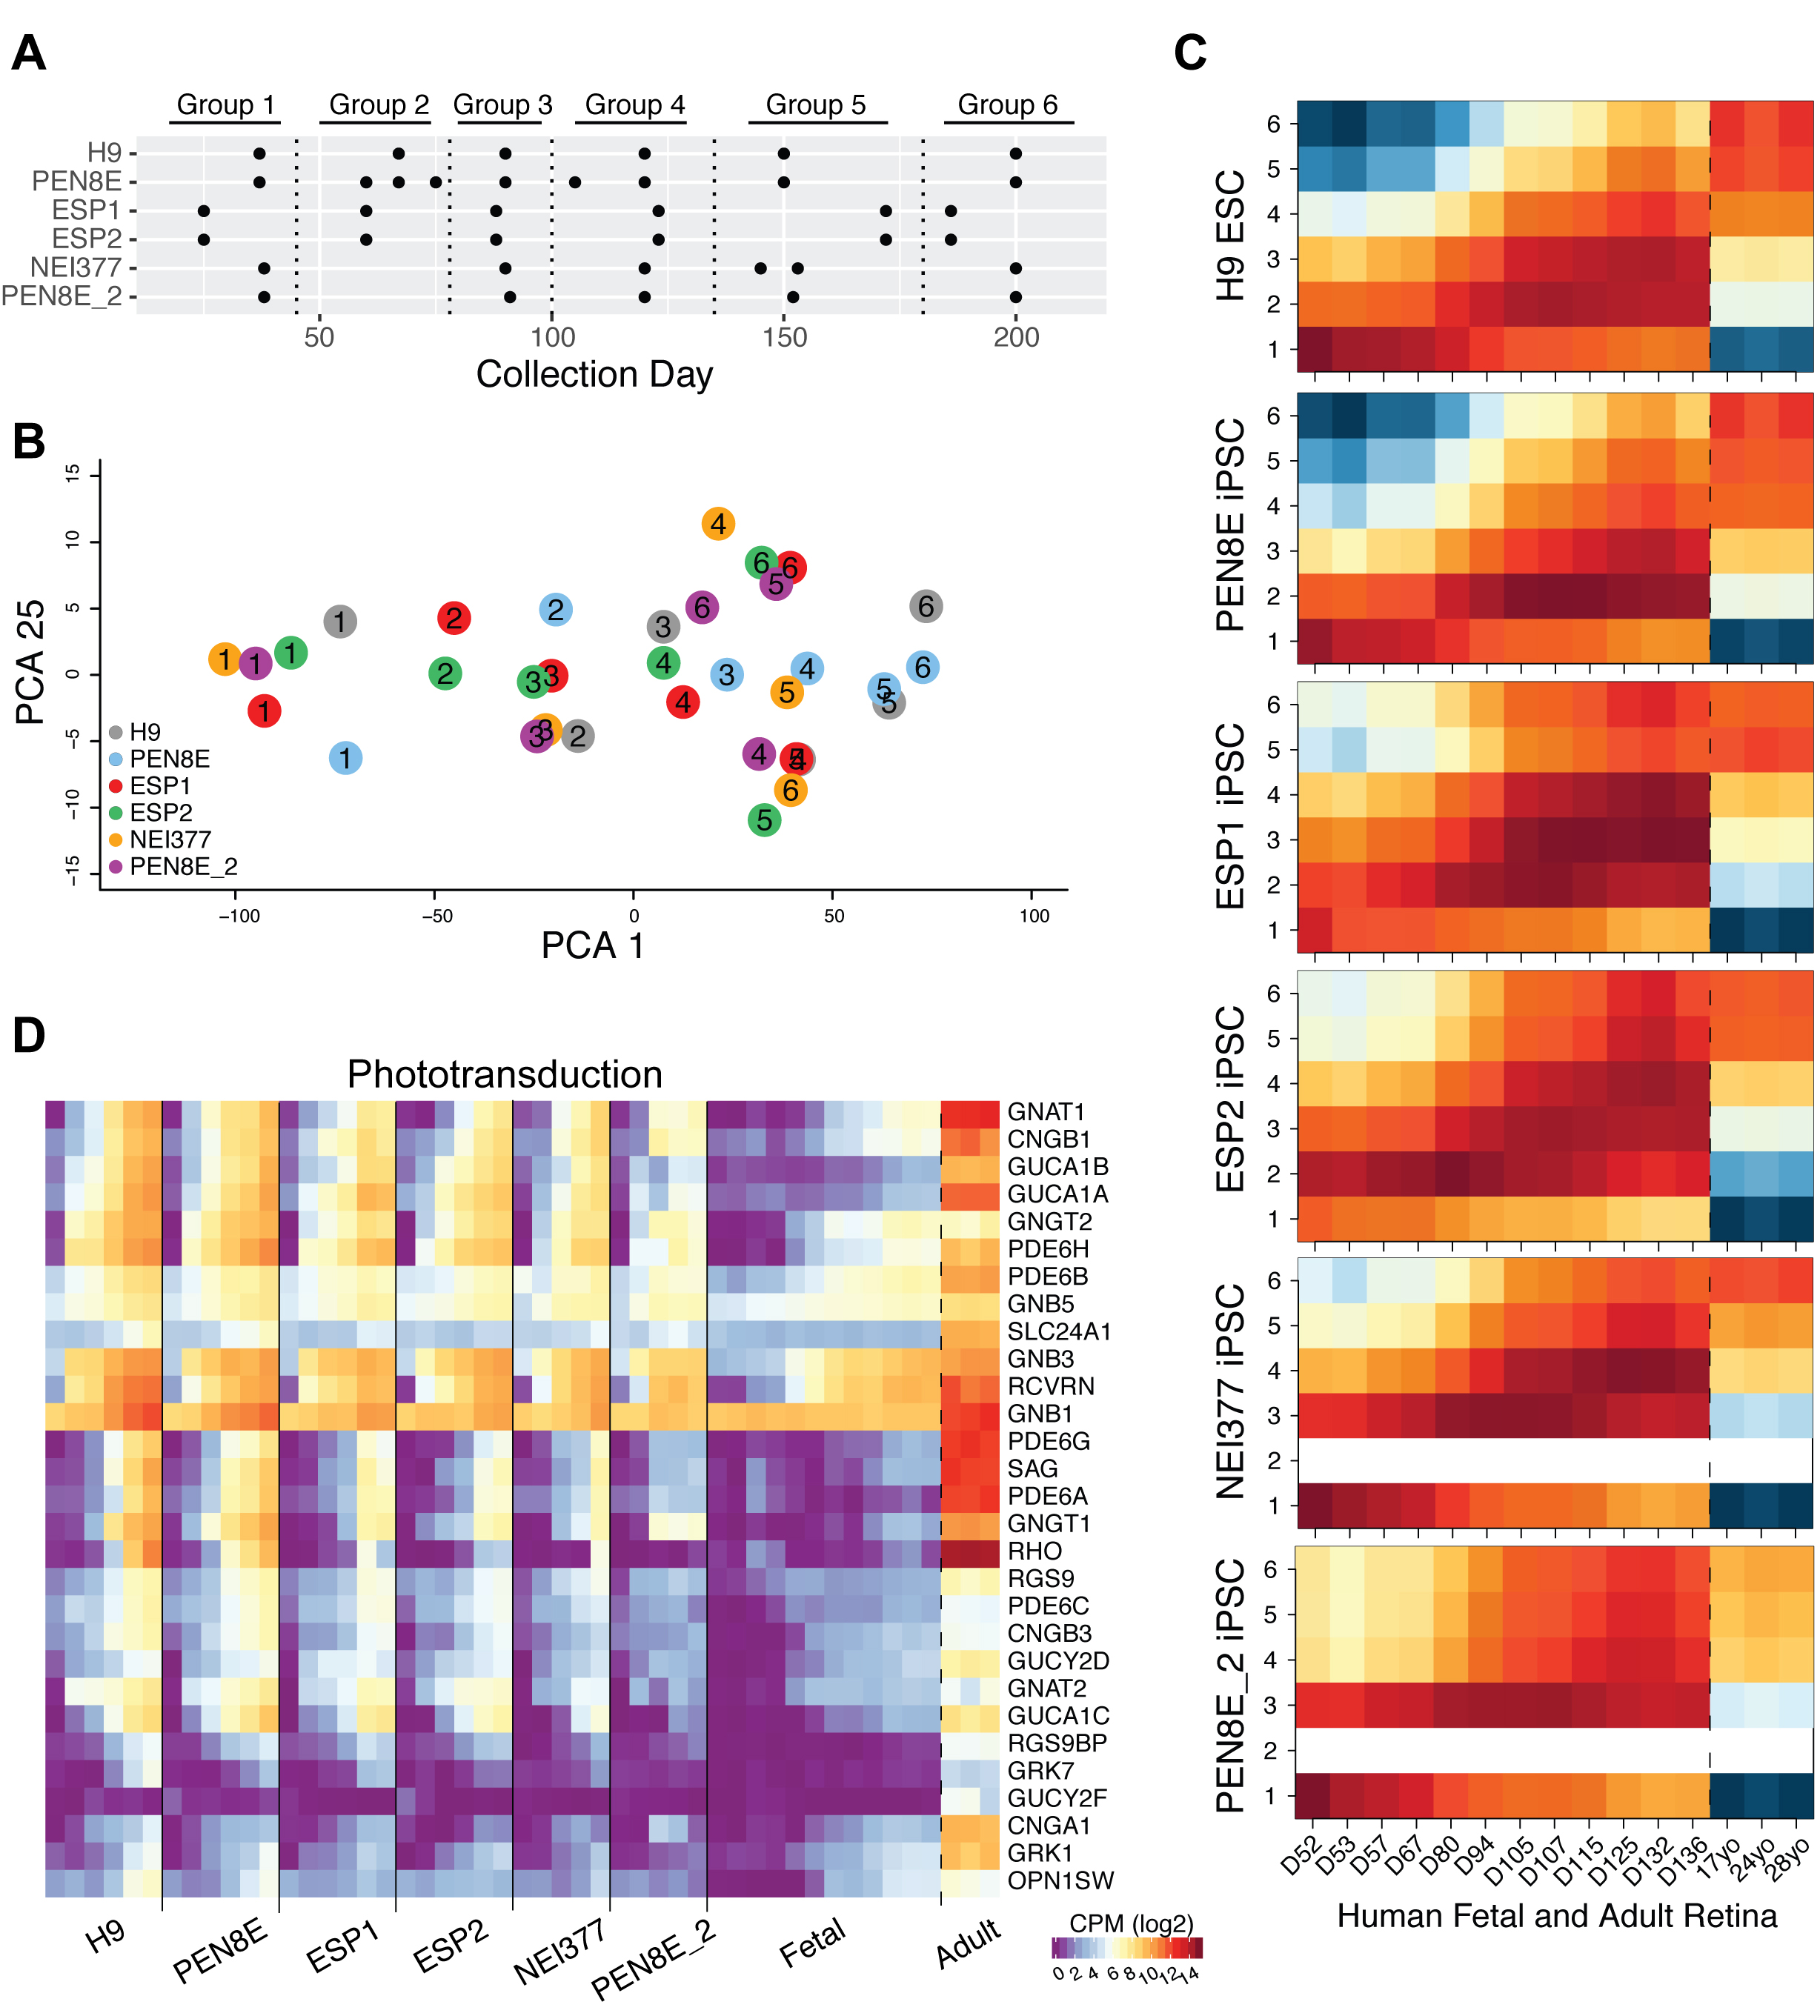
 Figure 3 of
Kaya, Mol Vis 2019; 25:663-678.
Figure 3 of
Kaya, Mol Vis 2019; 25:663-678.