Figure 2. Comparative transcriptome analysis of H9 (hESC)- and PEN8E (hiPSC)-derived retinal organoids. A: Venn diagram showing differentially expressed (DE) genes during organoid development from the H9 and PEN8E lines. The vast
majority of the DE genes are common (3851), with 1,041 and 1,749 unique to the H9 and PEN8E cell lines, respectively. B: Heatmap of 3,851 common DE genes, sorted and clustered based on row-wise z-score expression values in H9. Eight clusters
are evident. C: Reduced-redundancy Gene Ontology (GO) Biologic Process enrichment analysis of genes in each cluster. Clusters 1 and 7 did
not detect any statistically significantly enriched biologic processes. D: Heatmaps of GO cluster-related genes and their expression patterns in H9 and PEN8E retinal organoids. Expression count per
million (CPM; log2) values were used for analysis; color scale shown at the bottom right.
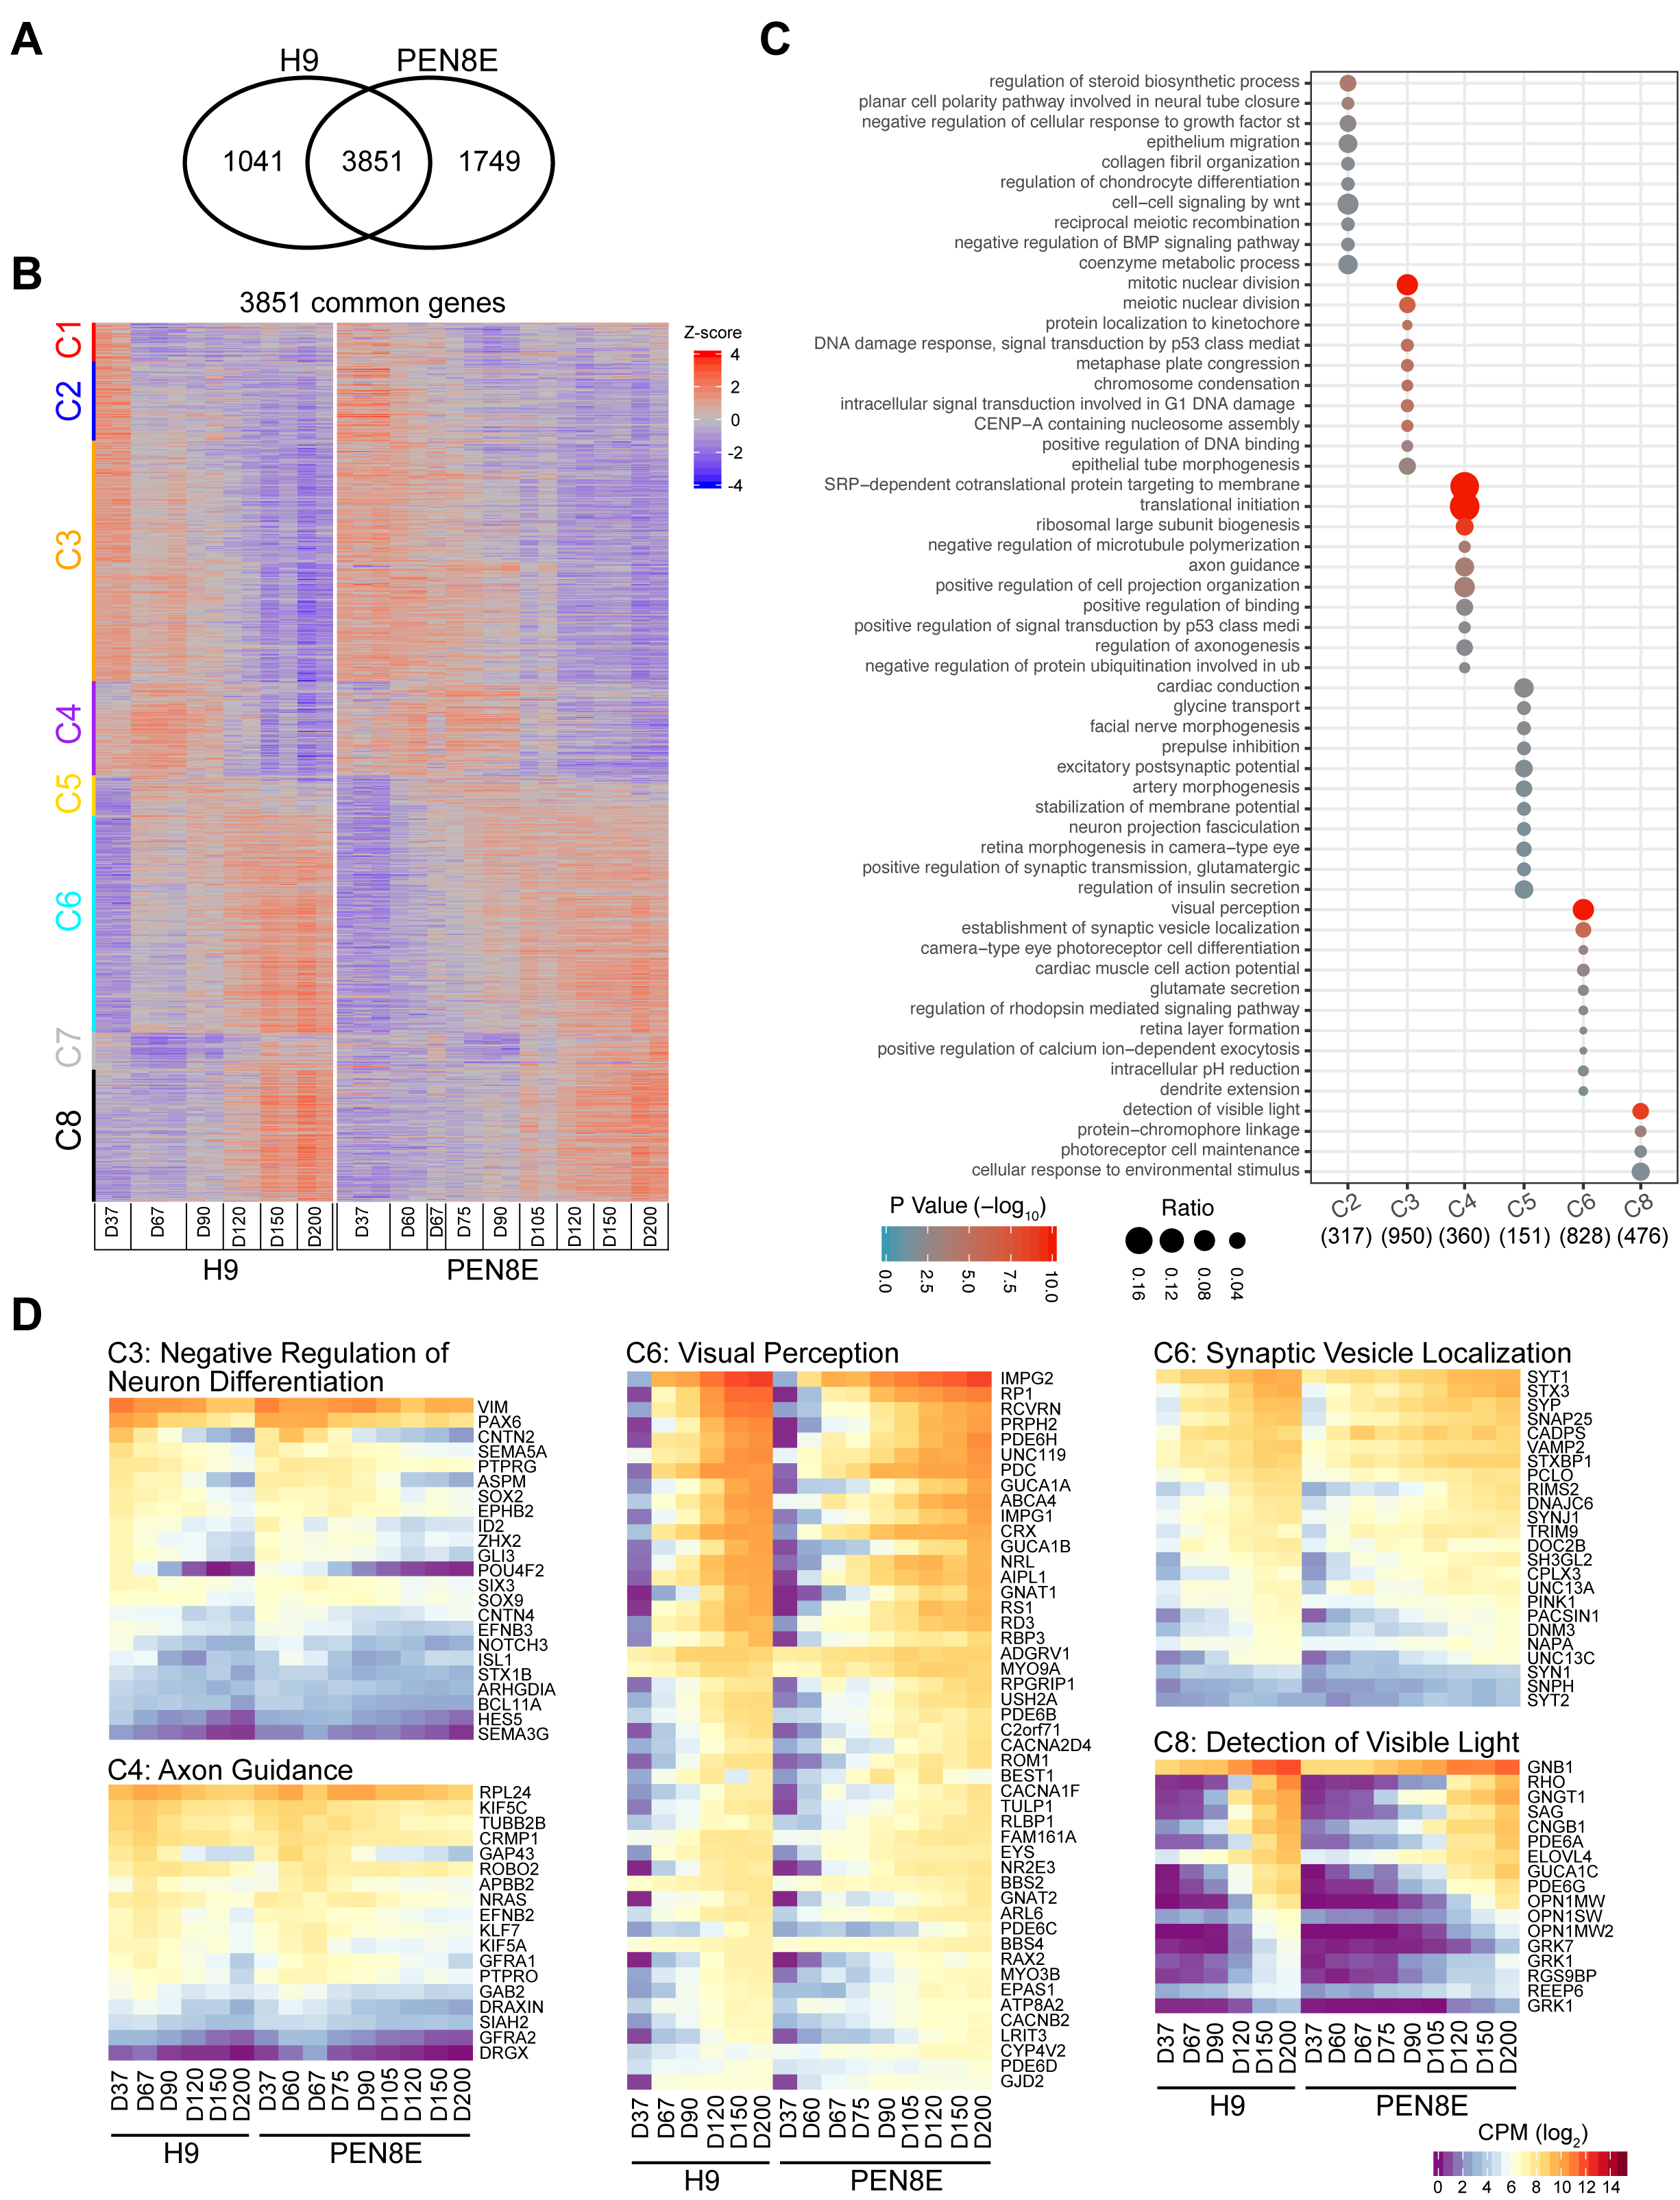
 Figure 2 of
Kaya, Mol Vis 2019; 25:663-678.
Figure 2 of
Kaya, Mol Vis 2019; 25:663-678.