Figure 4. Dark-adapted ERGs representing scotopic OPs. Oscillatory potentials (OPs) were recorded under dark adaptation in response
to a flash at intensity of 50 cd.s/m2. A: Representative waveforms of electroretinogram (ERG) performed with midazolam, medetomidine, and butorphanol tartrate (MMB
(left), pentobarbital sodium (PS; center), and ketamine/xylazine (KX; right). The waveforms were processed with a 65 Hz high-pass
filter and a 300 Hz low-pass filter to quantify the OPs. B: The amplitude of the OPs. Note that the amplitude of the OPs in the mice administered MMB was statistically significantly
larger than that in the mice administered pentobarbital sodium except OP1 and OP2. The amplitude of the OPs in the mice administered
MMB was statistically significantly larger than that in the mice administered KX for OP3. The amplitude of the OPs in the
mice administered KX tended to be larger than the amplitude of the mice administered PS. C: Note that the implicit time of the OPs in the mice administered PS was statistically significantly delayed compared to the
mice administered KX except OP1. The implicit time of the OPs in the mice administered PS showed a tendency for delay compared
to the mice administered MMB. Statistically significant differences are indicated as *p<0.05, †p<0.01, ‡p<0.001 using one-way factorial ANOVA (ANOVA) followed by Tukey’s test. Error bars indicate mean plus standard deviation (SD).
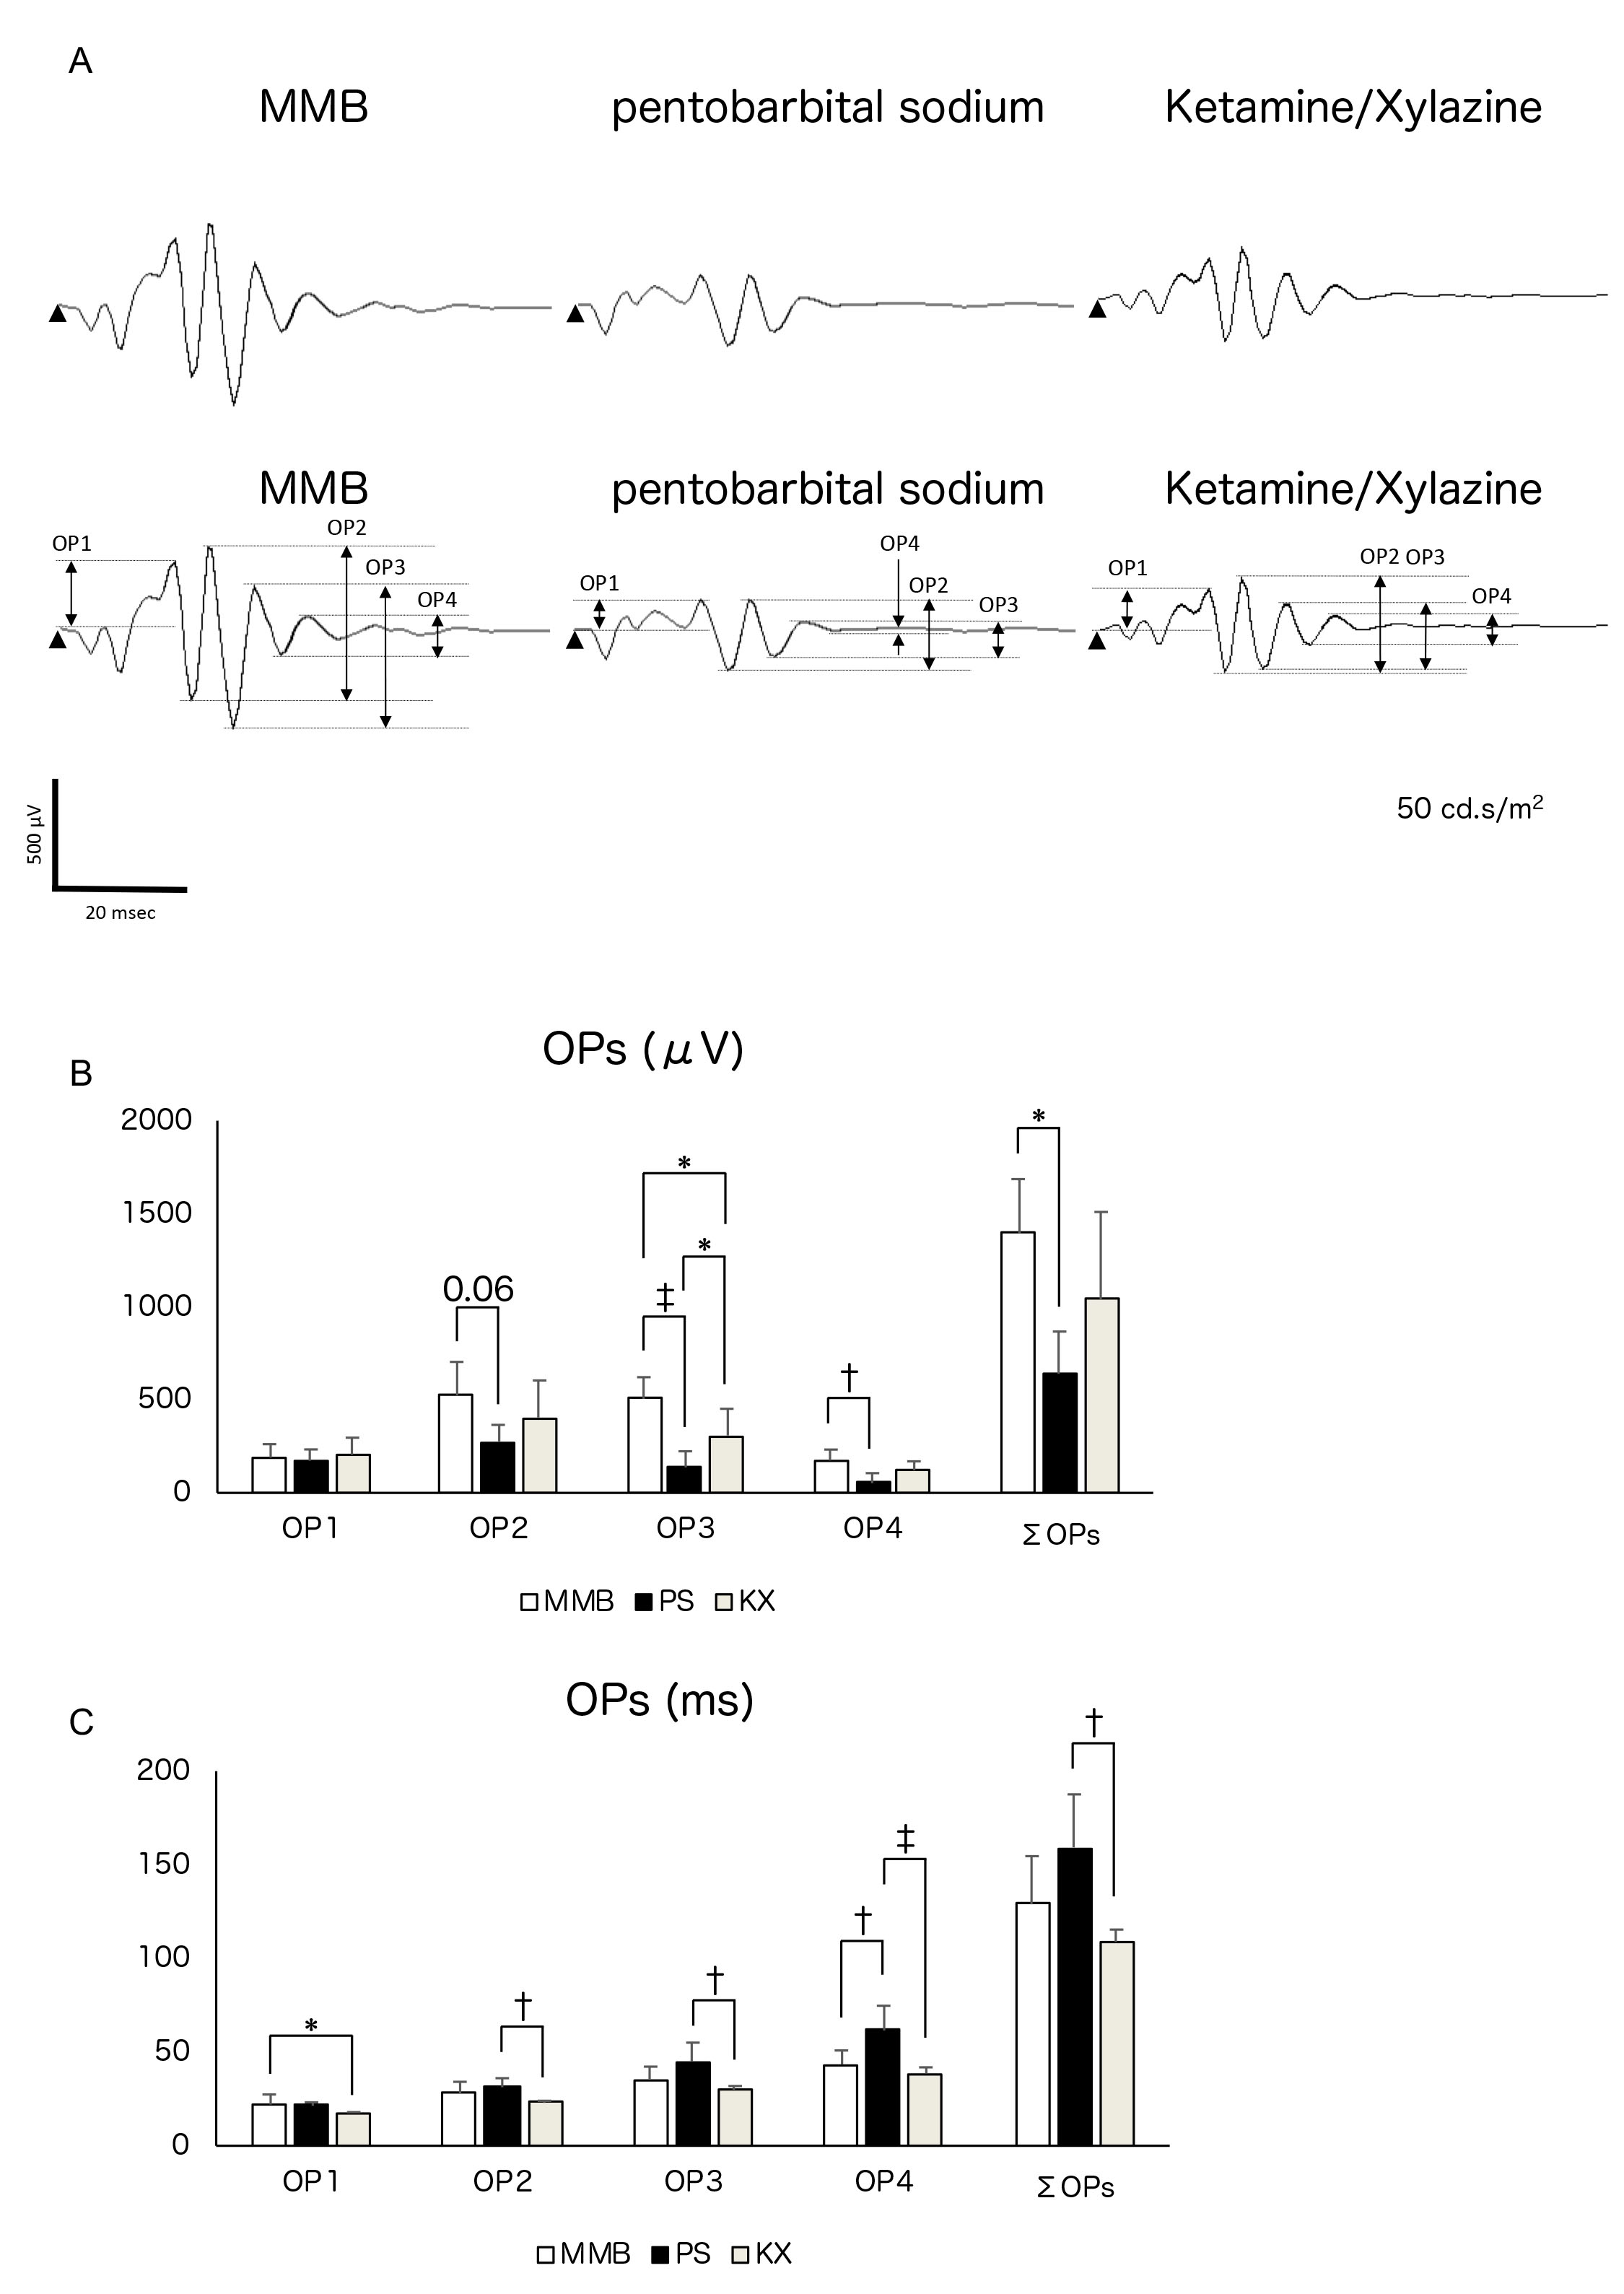
 Figure 4 of
Miwa, Mol Vis 2019; 25:645-653.
Figure 4 of
Miwa, Mol Vis 2019; 25:645-653.