Figure 2. Fitting of dark-adapted ERG a-waves. A: Representative a-wave fitting waveforms of midazolam, medetomidine, and butorphanol tartrate (MMB), pentobarbital sodium,
and ketamine/xylazine (KX). The log sensitivity (S), log maximum amplitude (Rmax), and delay before the onset of the a-wave (Td) parameters of each group are shown in B, C, and D, respectively. D: Note that the Td of the mice administered MMB and pentobarbital sodium was larger than that of the mice administered KX. Statistically significant
differences are indicated by ** for p<0.01 using one-way factorial ANOVA (ANOVA) followed by Tukey’s test.
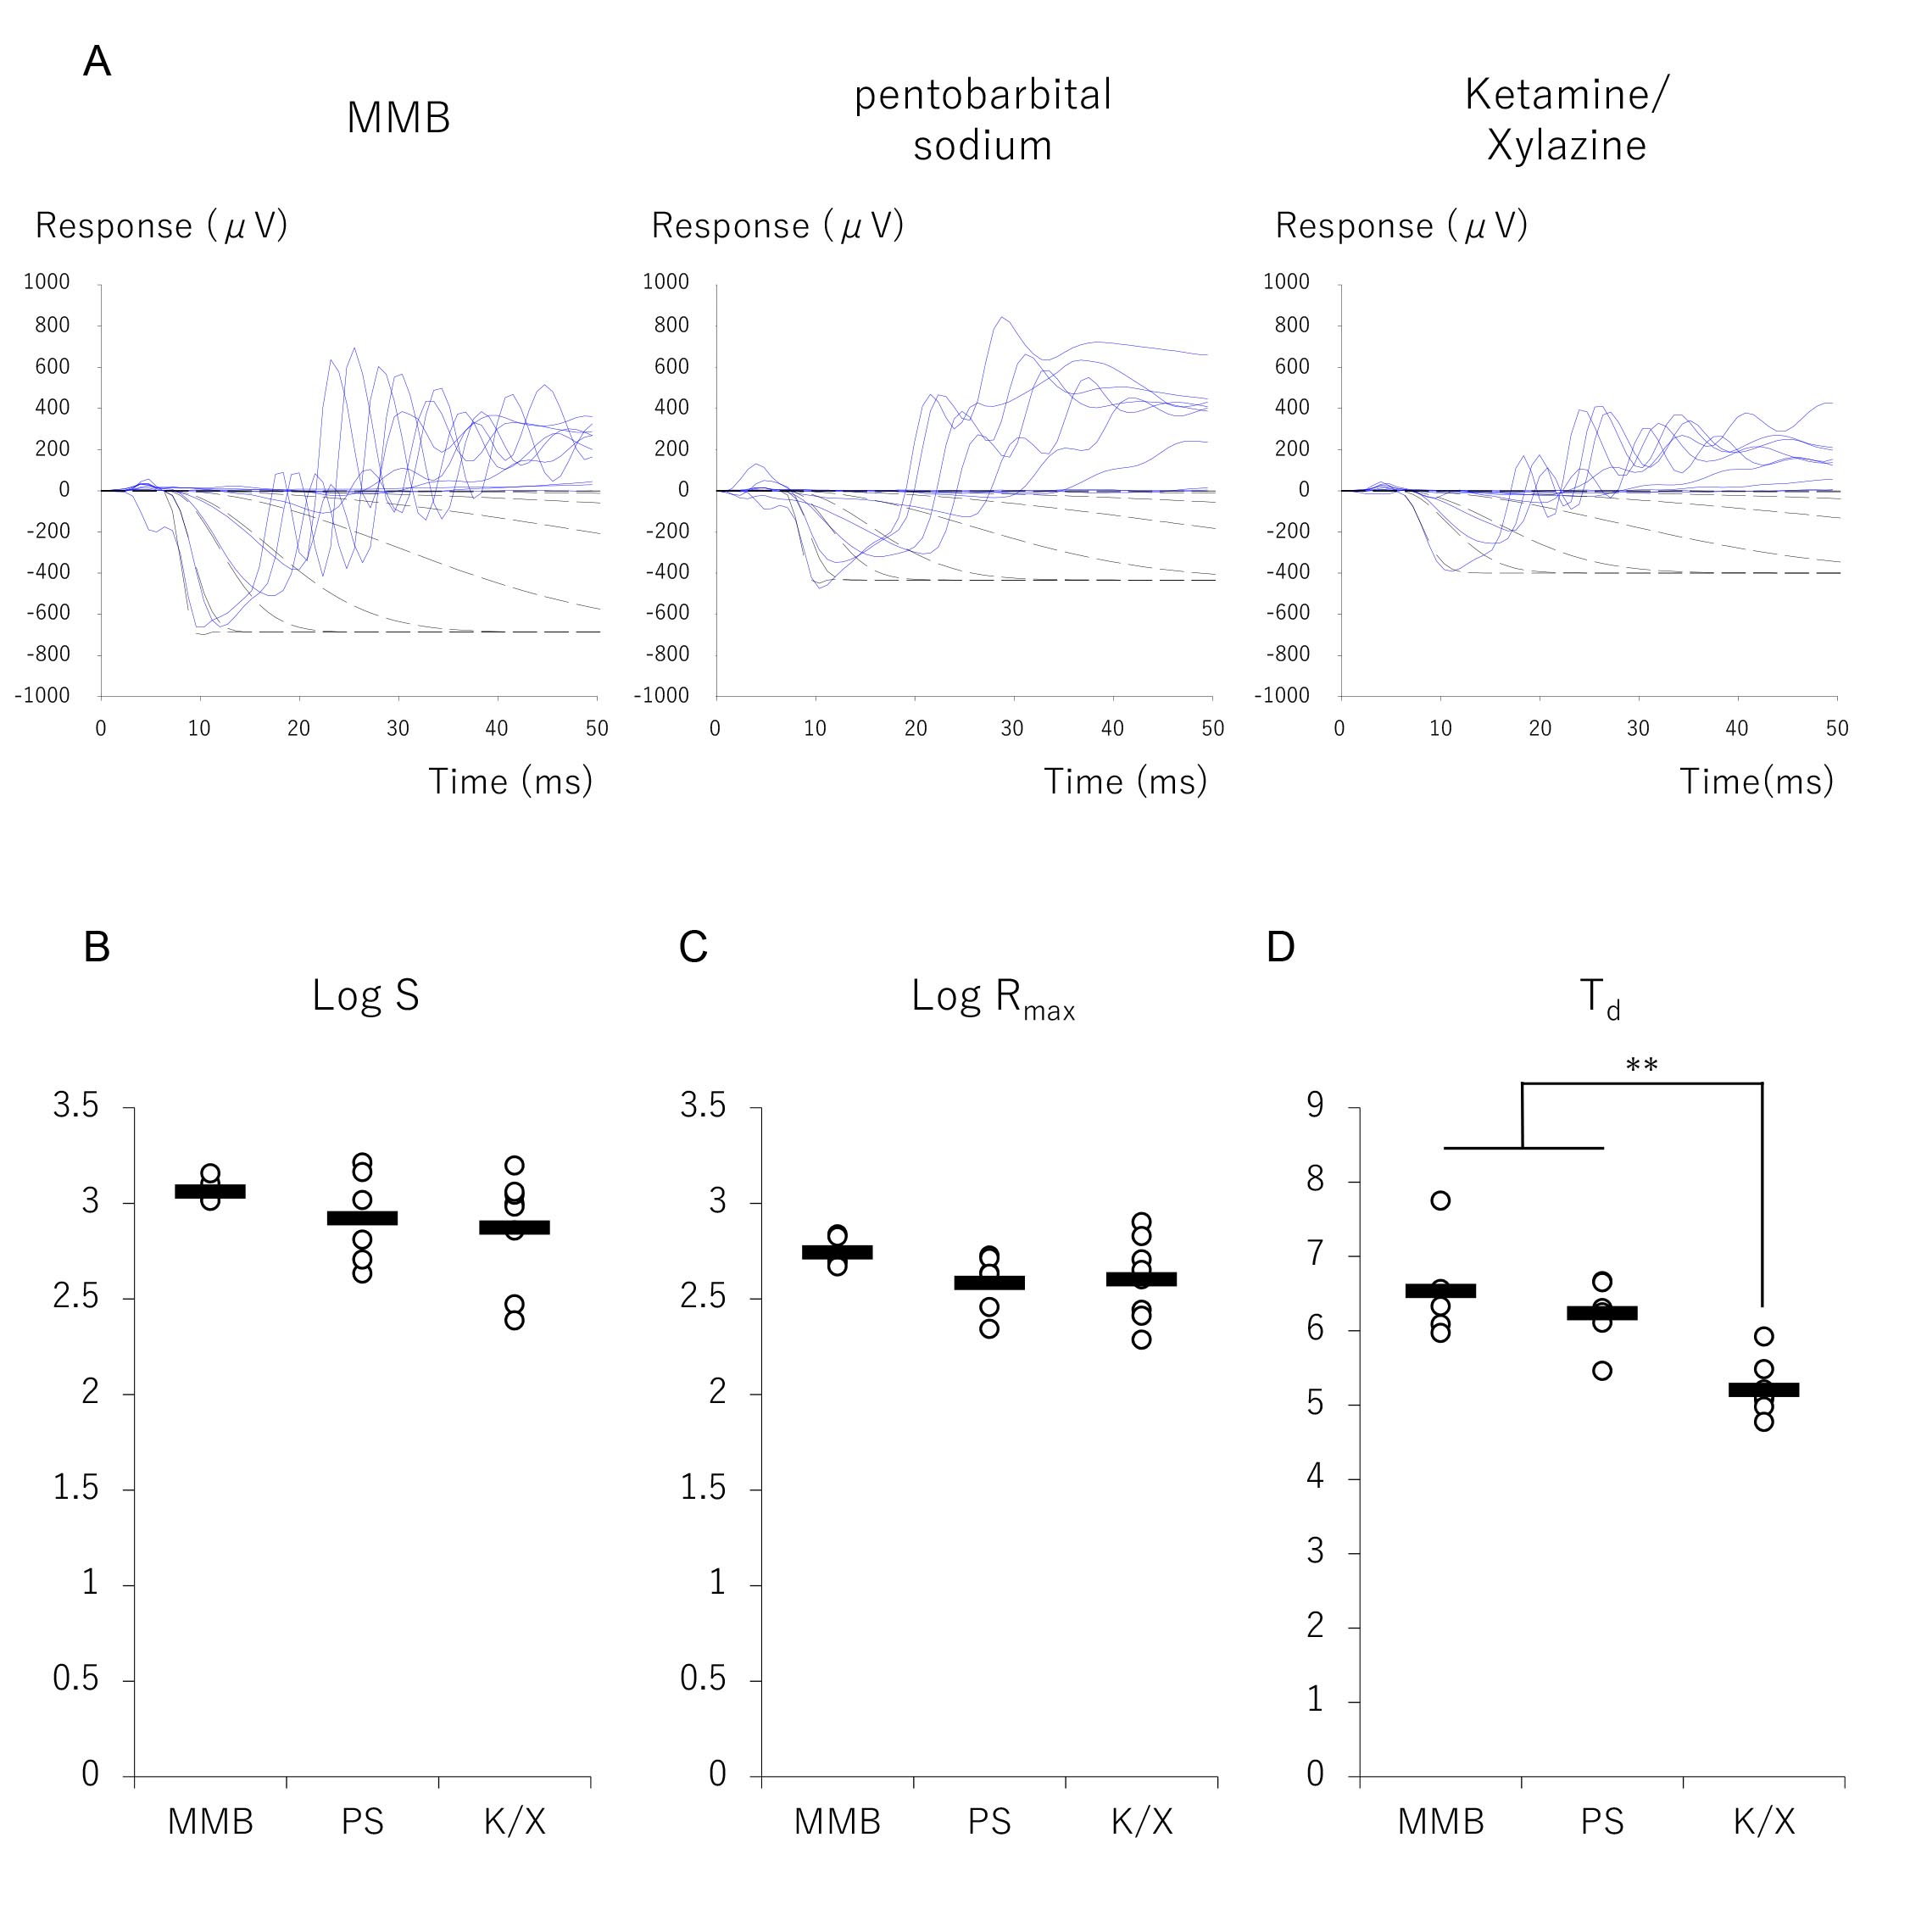
 Figure 2 of
Miwa, Mol Vis 2019; 25:645-653.
Figure 2 of
Miwa, Mol Vis 2019; 25:645-653.