Figure 3. GREM1 and SNAI1 had a similar expression trend in the progress of the epithelial-mesenchymal transition. A: The phase contrast micrographs show that the SB431542 group cells on day 2, 5, 10, 15, and 30 gradually develop the common
morphology of fetal RPE cells, but the control group cells lose the appearance of fetal RPE cells and gain mesenchymal-like
appearances. B: The quantitative PCR (qPCR) results show that the relation between GREM1 and SNAI1 in cells that were harvested on day 2, 5, 10, 15, and 30 had a similar trend. In the control group cells, GREM1 is upregulated gradually in the same manner as SNAI1, but RPE65 retains lower expression. In the SB431542 group cells, GREM1 and SNAI1 maintain lower expression while RPE65 is upregulated gradually. Scale bar: 500 μm. Data are shown as the mean ± standard error of mean (SEM), n=3. Ph: Phase contrast;
SB: SB431542.
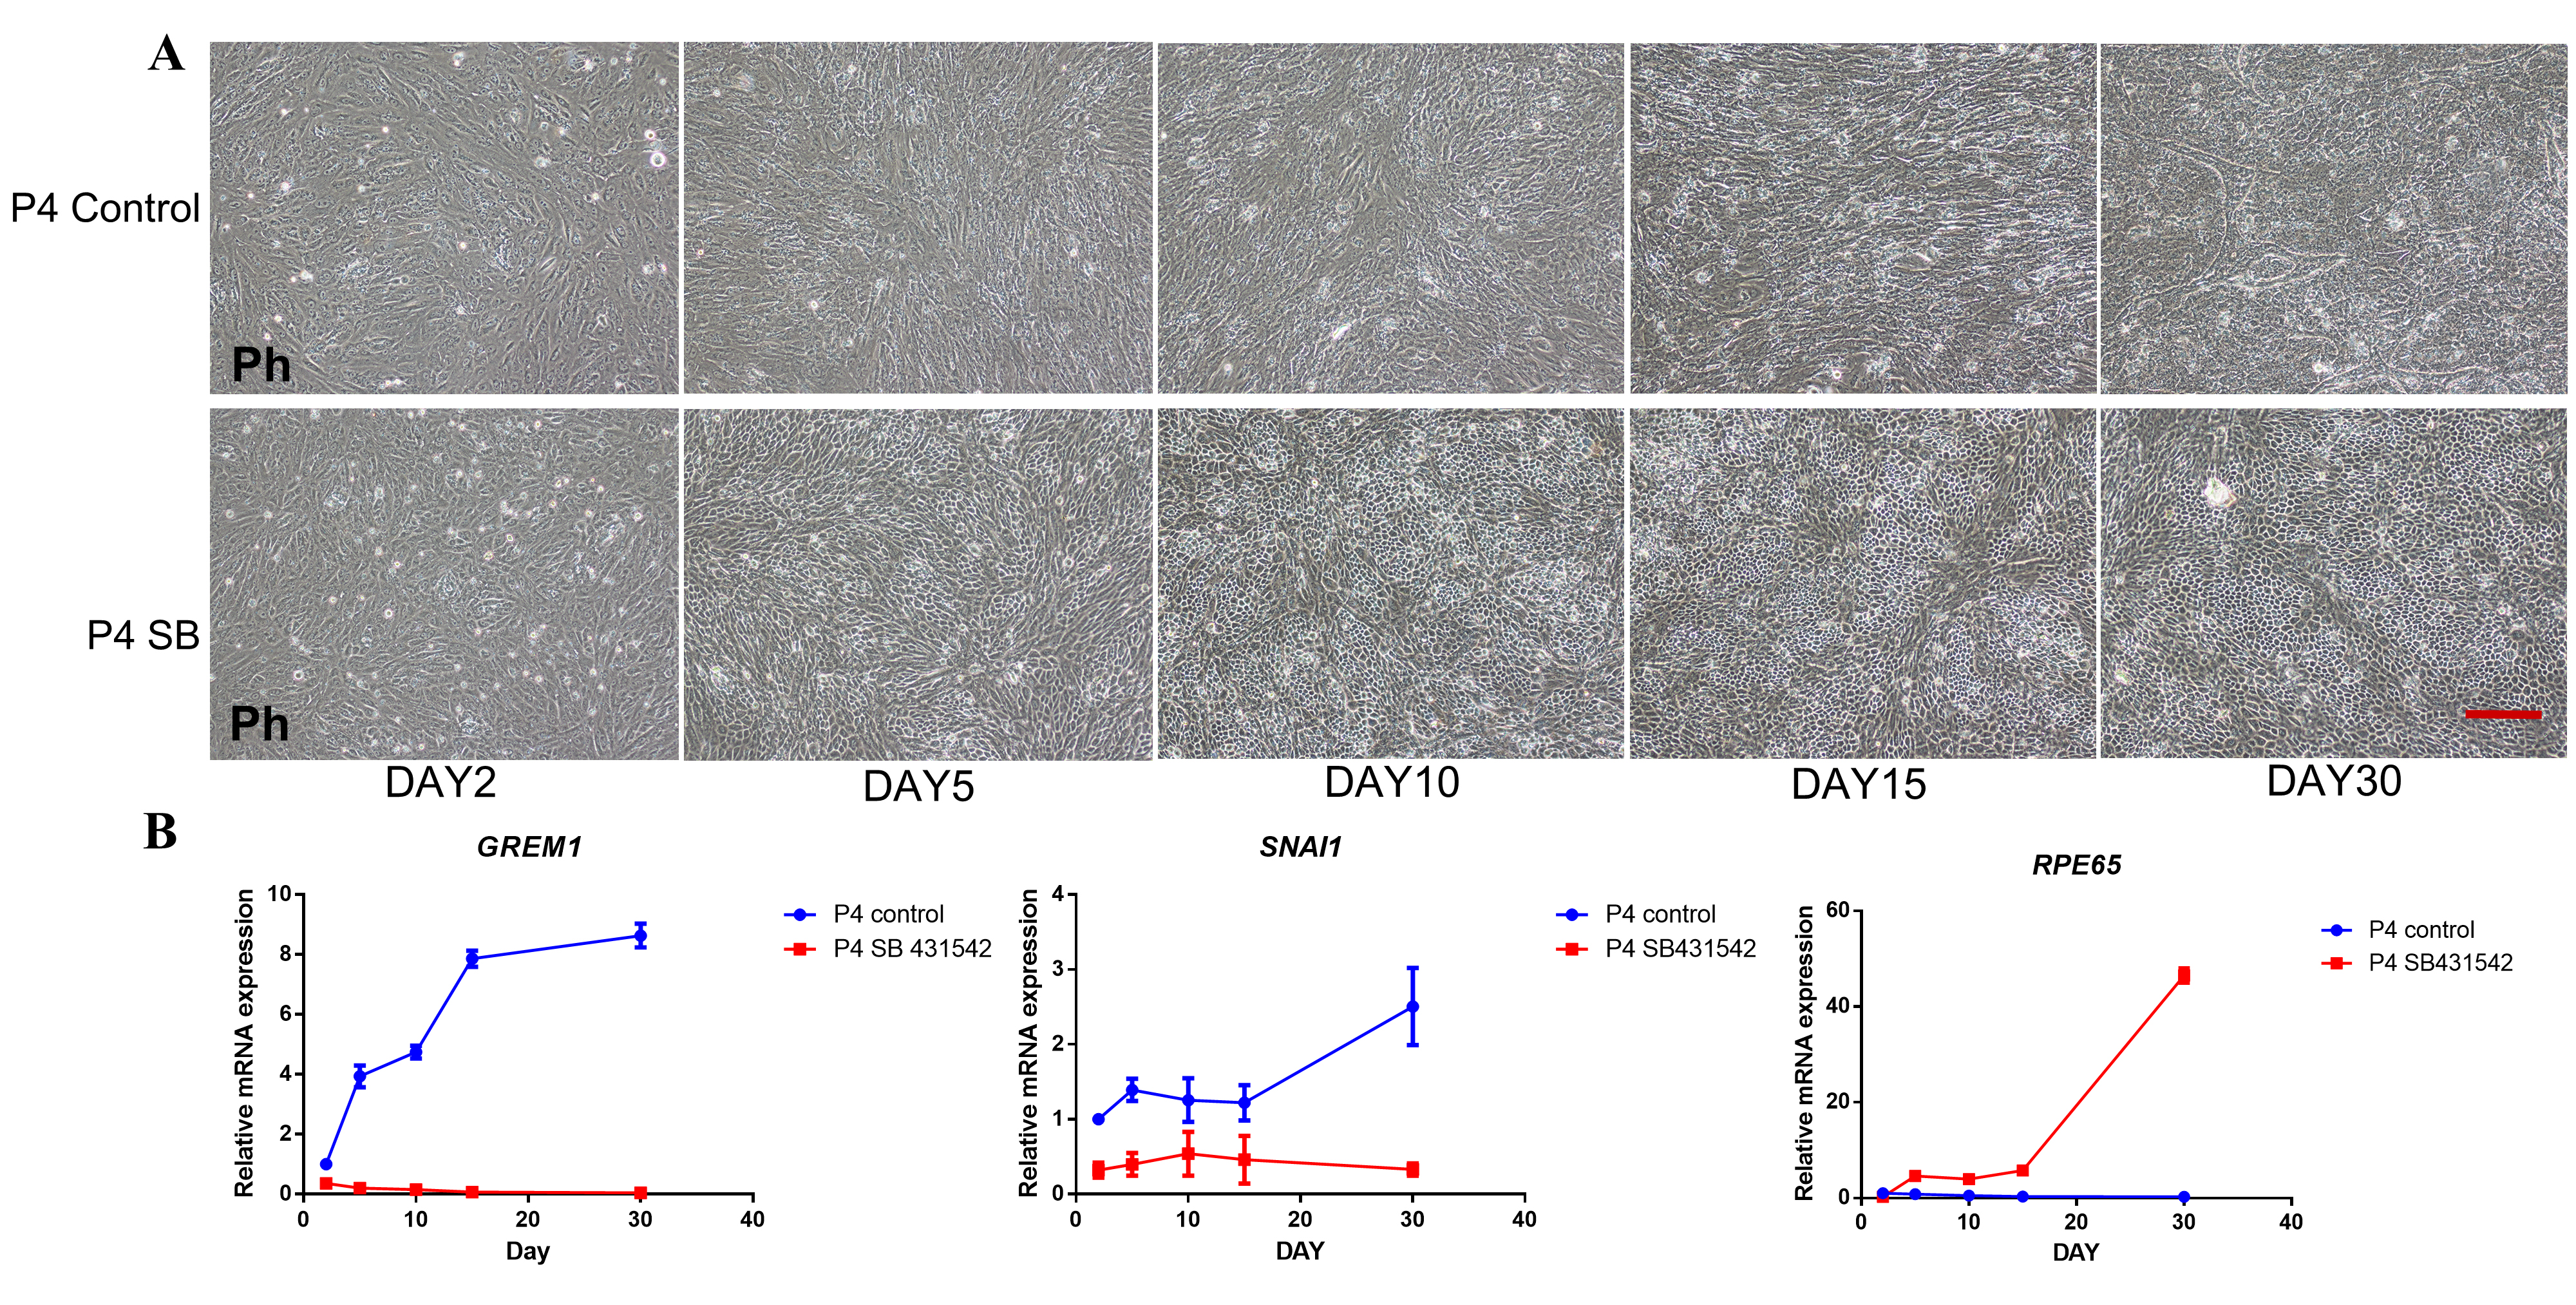
 Figure 3 of
Li, Mol Vis 2019; 25:625-635.
Figure 3 of
Li, Mol Vis 2019; 25:625-635.