Figure 1. FRAP protocol. A: Confocal image of a three-dimensional (3D) z-stack of the anterior capsule used to locate an area within the sample. Crosshairs
indicate the starting location of the fluorescence recovery after photobleaching (FRAP) protocol. B: Designated regions of interest (ROIs). Bleached ROI, red circle of 20 µm diameter, is the area to be bleached. Reference
ROI, blue circle of 15 µm diameter, is identified for photobleaching correction. Observed ROI, green circle of 7 µm diameter,
is the area monitored for fluorescence recovery. C: Time-lapse images of the full field of view during the FRAP protocol. D: Quantitative monitoring of the fluorescence intensity within the ROIs. The time to half maximum recovery is indicated.
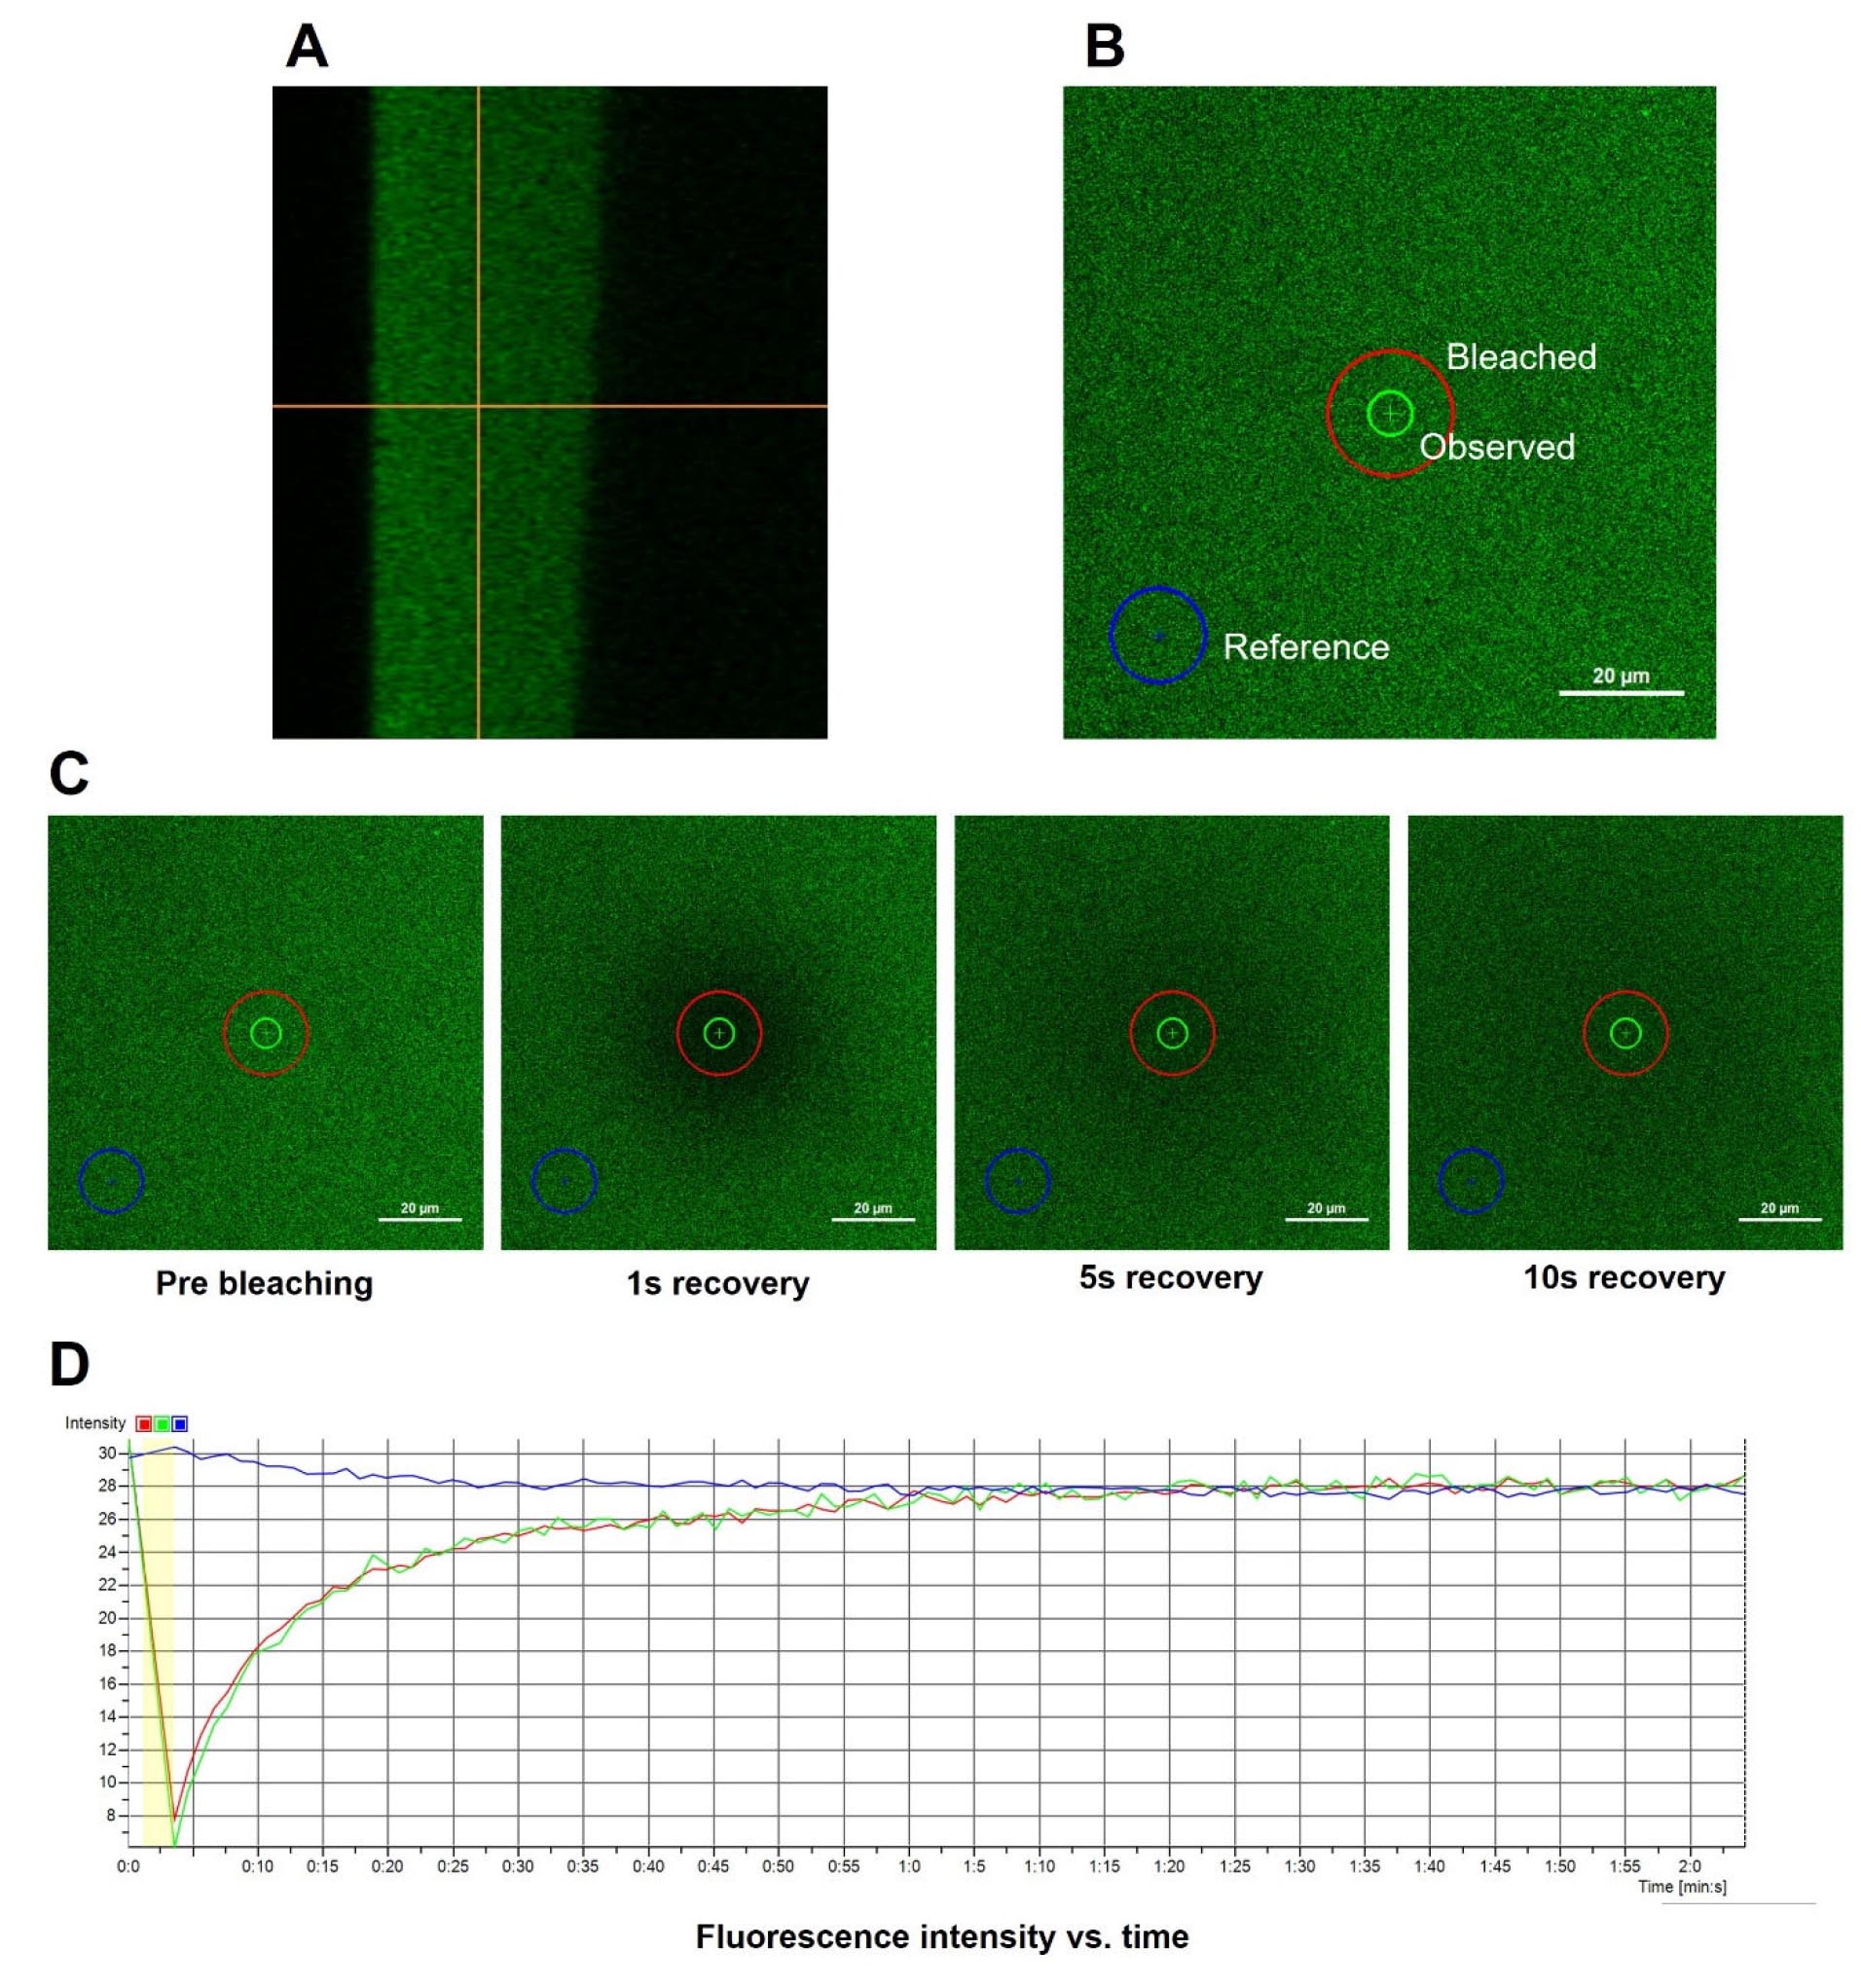
 Figure 1 of
Sueiras, Mol Vis 2019; 25:593-602.
Figure 1 of
Sueiras, Mol Vis 2019; 25:593-602.